Immigrants from Cambodia vs Somali College, Under 1 year
COMPARE
Immigrants from Cambodia
Somali
College, Under 1 year
College, Under 1 year Comparison
Immigrants from Cambodia
Somalis
61.5%
COLLEGE, UNDER 1 YEAR
0.4/ 100
METRIC RATING
254th/ 347
METRIC RANK
65.8%
COLLEGE, UNDER 1 YEAR
62.7/ 100
METRIC RATING
163rd/ 347
METRIC RANK
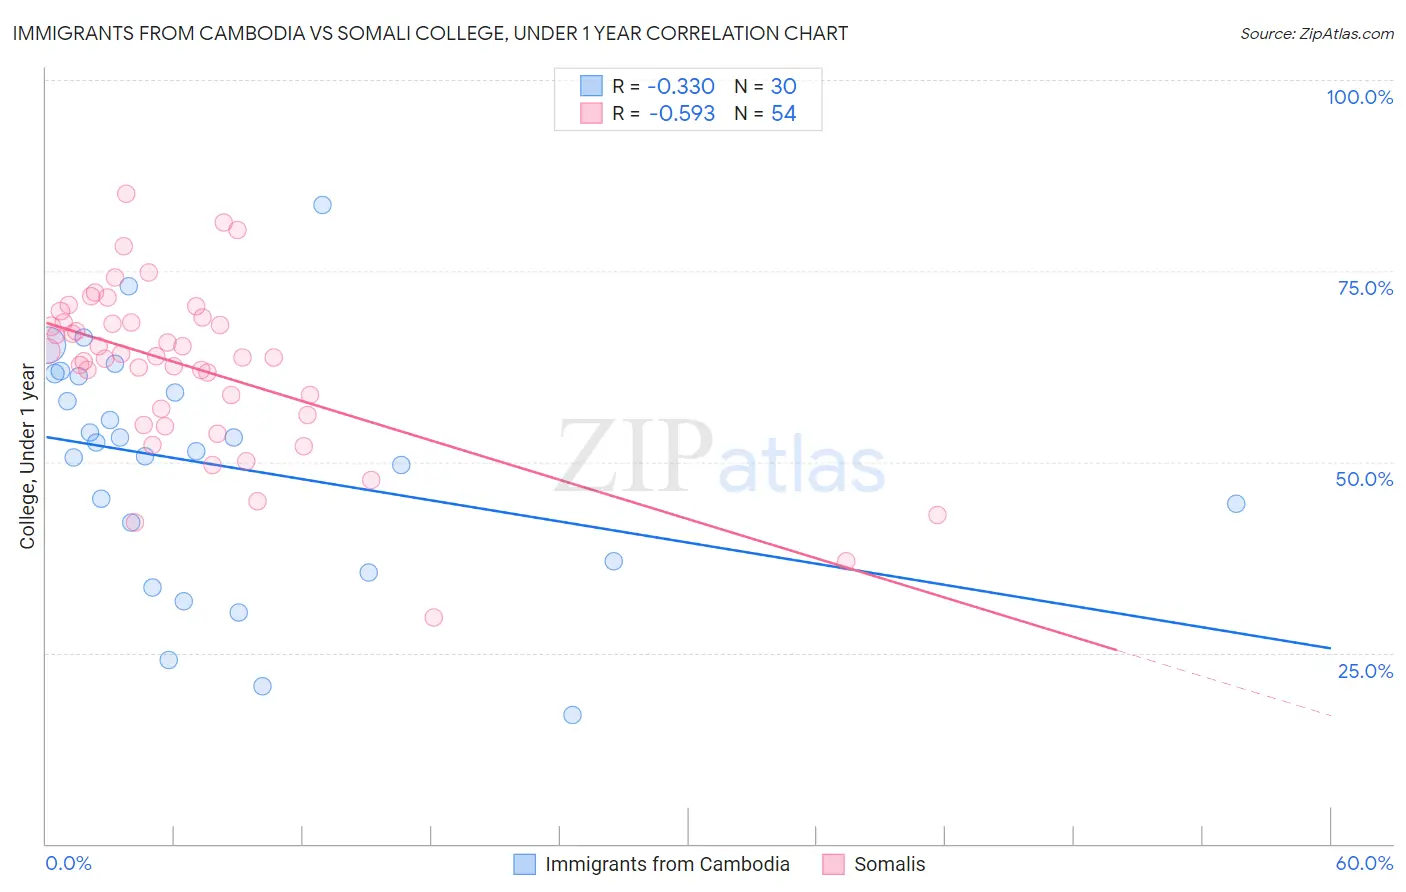
Immigrants from Cambodia vs Somali College, Under 1 year Correlation Chart
The statistical analysis conducted on geographies consisting of 205,153,442 people shows a mild negative correlation between the proportion of Immigrants from Cambodia and percentage of population with at least college, under 1 year education in the United States with a correlation coefficient (R) of -0.330 and weighted average of 61.5%. Similarly, the statistical analysis conducted on geographies consisting of 99,332,457 people shows a substantial negative correlation between the proportion of Somalis and percentage of population with at least college, under 1 year education in the United States with a correlation coefficient (R) of -0.593 and weighted average of 65.8%, a difference of 7.0%.
College, Under 1 year Correlation Summary
| Measurement | Immigrants from Cambodia | Somali |
| Minimum | 16.8% | 29.5% |
| Maximum | 83.7% | 85.2% |
| Range | 66.8% | 55.6% |
| Mean | 49.5% | 62.4% |
| Median | 52.0% | 63.8% |
| Interquartile 25% (IQ1) | 36.9% | 56.1% |
| Interquartile 75% (IQ3) | 61.3% | 68.3% |
| Interquartile Range (IQR) | 24.4% | 12.2% |
| Standard Deviation (Sample) | 15.6% | 10.9% |
| Standard Deviation (Population) | 15.3% | 10.8% |
Similar Demographics by College, Under 1 year
Demographics Similar to Immigrants from Cambodia by College, Under 1 year
In terms of college, under 1 year, the demographic groups most similar to Immigrants from Cambodia are West Indian (61.5%, a difference of 0.0%), Japanese (61.5%, a difference of 0.0%), Immigrants from Micronesia (61.5%, a difference of 0.11%), Comanche (61.4%, a difference of 0.12%), and Bangladeshi (61.4%, a difference of 0.17%).
| Demographics | Rating | Rank | College, Under 1 year |
| Immigrants | Liberia | 0.8 /100 | #247 | Tragic 61.9% |
| Potawatomi | 0.6 /100 | #248 | Tragic 61.8% |
| Vietnamese | 0.5 /100 | #249 | Tragic 61.7% |
| Immigrants | Congo | 0.5 /100 | #250 | Tragic 61.7% |
| Immigrants | Micronesia | 0.5 /100 | #251 | Tragic 61.5% |
| West Indians | 0.4 /100 | #252 | Tragic 61.5% |
| Japanese | 0.4 /100 | #253 | Tragic 61.5% |
| Immigrants | Cambodia | 0.4 /100 | #254 | Tragic 61.5% |
| Comanche | 0.4 /100 | #255 | Tragic 61.4% |
| Bangladeshis | 0.4 /100 | #256 | Tragic 61.4% |
| Immigrants | Laos | 0.3 /100 | #257 | Tragic 61.3% |
| Immigrants | Bangladesh | 0.3 /100 | #258 | Tragic 61.3% |
| Indonesians | 0.3 /100 | #259 | Tragic 61.2% |
| Blackfeet | 0.3 /100 | #260 | Tragic 61.1% |
| Africans | 0.3 /100 | #261 | Tragic 61.1% |
Demographics Similar to Somalis by College, Under 1 year
In terms of college, under 1 year, the demographic groups most similar to Somalis are Czechoslovakian (65.8%, a difference of 0.010%), Immigrants from Uzbekistan (65.8%, a difference of 0.050%), Korean (65.9%, a difference of 0.12%), Albanian (65.9%, a difference of 0.16%), and Brazilian (65.9%, a difference of 0.16%).
| Demographics | Rating | Rank | College, Under 1 year |
| Welsh | 69.9 /100 | #156 | Good 66.0% |
| Sierra Leoneans | 67.8 /100 | #157 | Good 66.0% |
| Celtics | 67.3 /100 | #158 | Good 65.9% |
| Tlingit-Haida | 66.4 /100 | #159 | Good 65.9% |
| Albanians | 66.1 /100 | #160 | Good 65.9% |
| Brazilians | 66.0 /100 | #161 | Good 65.9% |
| Koreans | 65.3 /100 | #162 | Good 65.9% |
| Somalis | 62.7 /100 | #163 | Good 65.8% |
| Czechoslovakians | 62.6 /100 | #164 | Good 65.8% |
| Immigrants | Uzbekistan | 61.6 /100 | #165 | Good 65.8% |
| Moroccans | 56.7 /100 | #166 | Average 65.6% |
| Immigrants | Somalia | 56.4 /100 | #167 | Average 65.6% |
| Hungarians | 55.9 /100 | #168 | Average 65.6% |
| Yugoslavians | 55.7 /100 | #169 | Average 65.6% |
| Germans | 55.7 /100 | #170 | Average 65.6% |