Immigrants from Cambodia vs Croatian College, Under 1 year
COMPARE
Immigrants from Cambodia
Croatian
College, Under 1 year
College, Under 1 year Comparison
Immigrants from Cambodia
Croatians
61.5%
COLLEGE, UNDER 1 YEAR
0.4/ 100
METRIC RATING
254th/ 347
METRIC RANK
68.3%
COLLEGE, UNDER 1 YEAR
98.2/ 100
METRIC RATING
88th/ 347
METRIC RANK
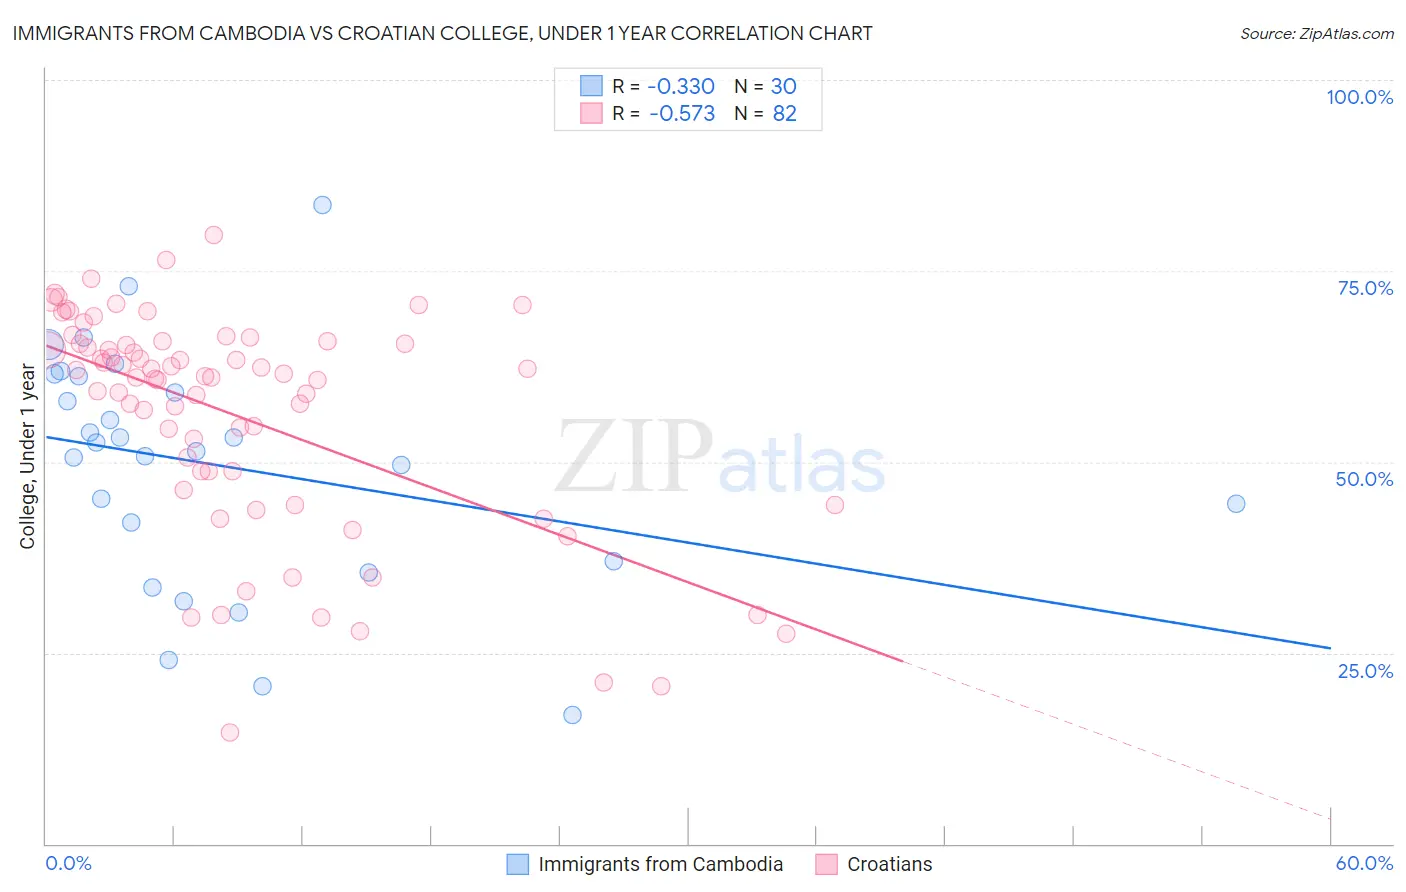
Immigrants from Cambodia vs Croatian College, Under 1 year Correlation Chart
The statistical analysis conducted on geographies consisting of 205,153,442 people shows a mild negative correlation between the proportion of Immigrants from Cambodia and percentage of population with at least college, under 1 year education in the United States with a correlation coefficient (R) of -0.330 and weighted average of 61.5%. Similarly, the statistical analysis conducted on geographies consisting of 375,730,237 people shows a substantial negative correlation between the proportion of Croatians and percentage of population with at least college, under 1 year education in the United States with a correlation coefficient (R) of -0.573 and weighted average of 68.3%, a difference of 11.1%.
College, Under 1 year Correlation Summary
| Measurement | Immigrants from Cambodia | Croatian |
| Minimum | 16.8% | 14.6% |
| Maximum | 83.7% | 79.7% |
| Range | 66.8% | 65.1% |
| Mean | 49.5% | 56.1% |
| Median | 52.0% | 61.1% |
| Interquartile 25% (IQ1) | 36.9% | 48.7% |
| Interquartile 75% (IQ3) | 61.3% | 65.5% |
| Interquartile Range (IQR) | 24.4% | 16.8% |
| Standard Deviation (Sample) | 15.6% | 14.5% |
| Standard Deviation (Population) | 15.3% | 14.5% |
Similar Demographics by College, Under 1 year
Demographics Similar to Immigrants from Cambodia by College, Under 1 year
In terms of college, under 1 year, the demographic groups most similar to Immigrants from Cambodia are West Indian (61.5%, a difference of 0.0%), Japanese (61.5%, a difference of 0.0%), Immigrants from Micronesia (61.5%, a difference of 0.11%), Comanche (61.4%, a difference of 0.12%), and Bangladeshi (61.4%, a difference of 0.17%).
| Demographics | Rating | Rank | College, Under 1 year |
| Immigrants | Liberia | 0.8 /100 | #247 | Tragic 61.9% |
| Potawatomi | 0.6 /100 | #248 | Tragic 61.8% |
| Vietnamese | 0.5 /100 | #249 | Tragic 61.7% |
| Immigrants | Congo | 0.5 /100 | #250 | Tragic 61.7% |
| Immigrants | Micronesia | 0.5 /100 | #251 | Tragic 61.5% |
| West Indians | 0.4 /100 | #252 | Tragic 61.5% |
| Japanese | 0.4 /100 | #253 | Tragic 61.5% |
| Immigrants | Cambodia | 0.4 /100 | #254 | Tragic 61.5% |
| Comanche | 0.4 /100 | #255 | Tragic 61.4% |
| Bangladeshis | 0.4 /100 | #256 | Tragic 61.4% |
| Immigrants | Laos | 0.3 /100 | #257 | Tragic 61.3% |
| Immigrants | Bangladesh | 0.3 /100 | #258 | Tragic 61.3% |
| Indonesians | 0.3 /100 | #259 | Tragic 61.2% |
| Blackfeet | 0.3 /100 | #260 | Tragic 61.1% |
| Africans | 0.3 /100 | #261 | Tragic 61.1% |
Demographics Similar to Croatians by College, Under 1 year
In terms of college, under 1 year, the demographic groups most similar to Croatians are Ethiopian (68.3%, a difference of 0.010%), Chinese (68.3%, a difference of 0.020%), Immigrants from Lebanon (68.3%, a difference of 0.040%), Immigrants from Hungary (68.3%, a difference of 0.050%), and Egyptian (68.3%, a difference of 0.050%).
| Demographics | Rating | Rank | College, Under 1 year |
| Immigrants | Greece | 98.5 /100 | #81 | Exceptional 68.4% |
| Norwegians | 98.4 /100 | #82 | Exceptional 68.4% |
| Argentineans | 98.4 /100 | #83 | Exceptional 68.4% |
| Immigrants | Hungary | 98.3 /100 | #84 | Exceptional 68.3% |
| Egyptians | 98.3 /100 | #85 | Exceptional 68.3% |
| Immigrants | Lebanon | 98.3 /100 | #86 | Exceptional 68.3% |
| Chinese | 98.3 /100 | #87 | Exceptional 68.3% |
| Croatians | 98.2 /100 | #88 | Exceptional 68.3% |
| Ethiopians | 98.2 /100 | #89 | Exceptional 68.3% |
| Icelanders | 98.1 /100 | #90 | Exceptional 68.3% |
| Europeans | 98.1 /100 | #91 | Exceptional 68.2% |
| Luxembourgers | 98.1 /100 | #92 | Exceptional 68.2% |
| Romanians | 97.9 /100 | #93 | Exceptional 68.2% |
| Armenians | 97.7 /100 | #94 | Exceptional 68.1% |
| Immigrants | Pakistan | 97.5 /100 | #95 | Exceptional 68.0% |