Immigrants from Cambodia vs Immigrants from Moldova GED/Equivalency
COMPARE
Immigrants from Cambodia
Immigrants from Moldova
GED/Equivalency
GED/Equivalency Comparison
Immigrants from Cambodia
Immigrants from Moldova
82.2%
GED/EQUIVALENCY
0.0/ 100
METRIC RATING
289th/ 347
METRIC RANK
87.7%
GED/EQUIVALENCY
98.8/ 100
METRIC RATING
72nd/ 347
METRIC RANK
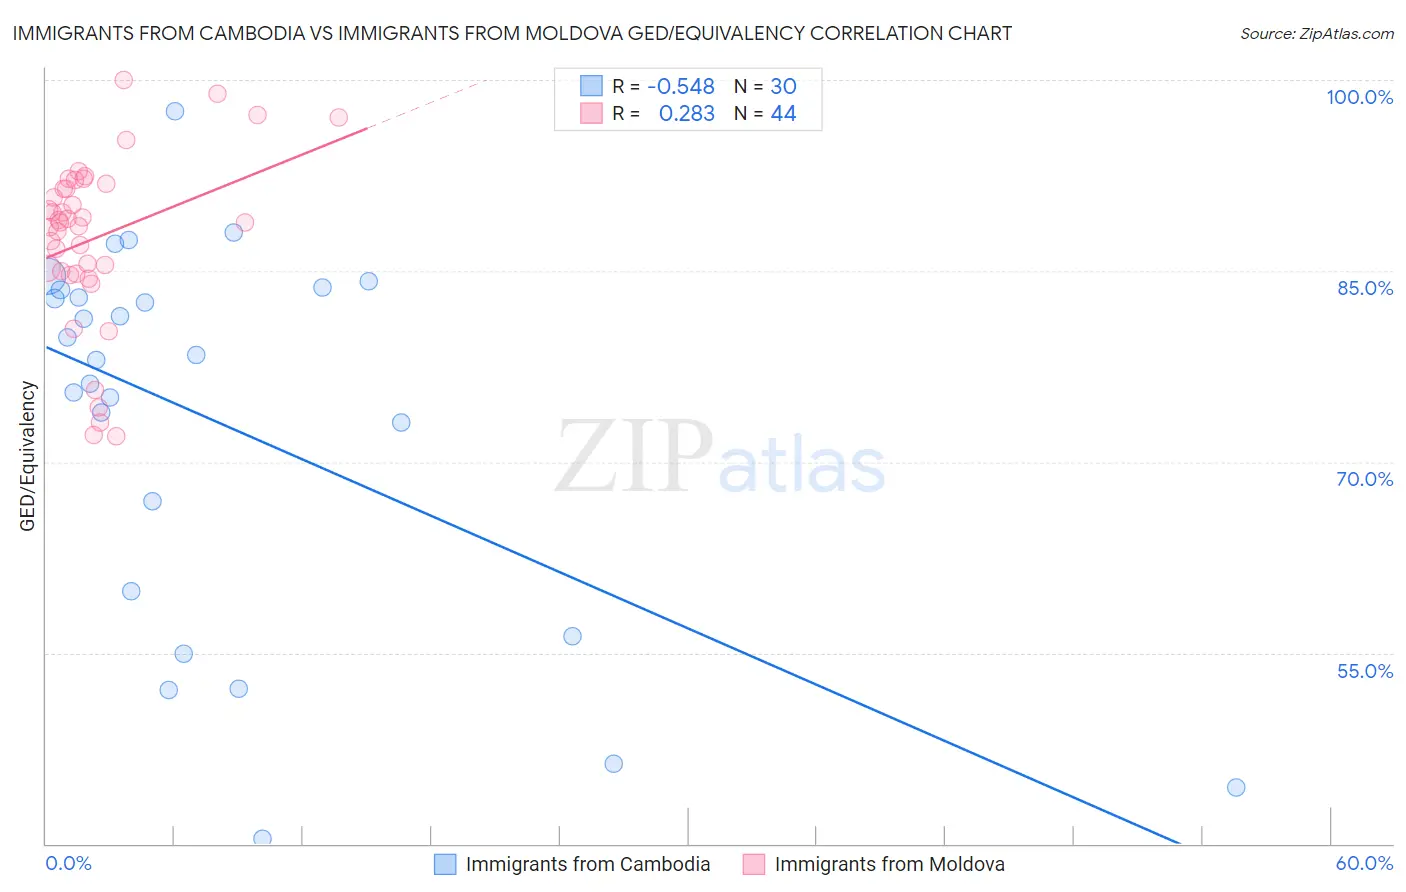
Immigrants from Cambodia vs Immigrants from Moldova GED/Equivalency Correlation Chart
The statistical analysis conducted on geographies consisting of 205,153,442 people shows a substantial negative correlation between the proportion of Immigrants from Cambodia and percentage of population with at least ged/equivalency education in the United States with a correlation coefficient (R) of -0.548 and weighted average of 82.2%. Similarly, the statistical analysis conducted on geographies consisting of 124,401,069 people shows a weak positive correlation between the proportion of Immigrants from Moldova and percentage of population with at least ged/equivalency education in the United States with a correlation coefficient (R) of 0.283 and weighted average of 87.7%, a difference of 6.7%.
GED/Equivalency Correlation Summary
| Measurement | Immigrants from Cambodia | Immigrants from Moldova |
| Minimum | 40.4% | 72.0% |
| Maximum | 97.5% | 100.0% |
| Range | 57.1% | 28.0% |
| Mean | 73.0% | 87.6% |
| Median | 78.2% | 88.8% |
| Interquartile 25% (IQ1) | 59.8% | 84.9% |
| Interquartile 75% (IQ3) | 83.5% | 91.7% |
| Interquartile Range (IQR) | 23.7% | 6.8% |
| Standard Deviation (Sample) | 15.0% | 6.7% |
| Standard Deviation (Population) | 14.8% | 6.6% |
Similar Demographics by GED/Equivalency
Demographics Similar to Immigrants from Cambodia by GED/Equivalency
In terms of ged/equivalency, the demographic groups most similar to Immigrants from Cambodia are Pueblo (82.3%, a difference of 0.080%), Japanese (82.4%, a difference of 0.18%), Immigrants from West Indies (82.4%, a difference of 0.19%), Haitian (82.1%, a difference of 0.19%), and Cajun (82.4%, a difference of 0.22%).
| Demographics | Rating | Rank | GED/Equivalency |
| Immigrants | Immigrants | 0.1 /100 | #282 | Tragic 82.6% |
| Indonesians | 0.1 /100 | #283 | Tragic 82.5% |
| Immigrants | Barbados | 0.1 /100 | #284 | Tragic 82.4% |
| Cajuns | 0.0 /100 | #285 | Tragic 82.4% |
| Immigrants | West Indies | 0.0 /100 | #286 | Tragic 82.4% |
| Japanese | 0.0 /100 | #287 | Tragic 82.4% |
| Pueblo | 0.0 /100 | #288 | Tragic 82.3% |
| Immigrants | Cambodia | 0.0 /100 | #289 | Tragic 82.2% |
| Haitians | 0.0 /100 | #290 | Tragic 82.1% |
| Cubans | 0.0 /100 | #291 | Tragic 82.0% |
| Paiute | 0.0 /100 | #292 | Tragic 82.0% |
| British West Indians | 0.0 /100 | #293 | Tragic 82.0% |
| Immigrants | St. Vincent and the Grenadines | 0.0 /100 | #294 | Tragic 82.0% |
| Nepalese | 0.0 /100 | #295 | Tragic 81.9% |
| Vietnamese | 0.0 /100 | #296 | Tragic 81.9% |
Demographics Similar to Immigrants from Moldova by GED/Equivalency
In terms of ged/equivalency, the demographic groups most similar to Immigrants from Moldova are Ukrainian (87.7%, a difference of 0.0%), Austrian (87.7%, a difference of 0.0%), Belgian (87.7%, a difference of 0.010%), Immigrants from Kuwait (87.7%, a difference of 0.030%), and Immigrants from Saudi Arabia (87.8%, a difference of 0.050%).
| Demographics | Rating | Rank | GED/Equivalency |
| Immigrants | North America | 99.1 /100 | #65 | Exceptional 87.8% |
| Immigrants | Bulgaria | 99.1 /100 | #66 | Exceptional 87.8% |
| British | 99.1 /100 | #67 | Exceptional 87.8% |
| Immigrants | France | 99.1 /100 | #68 | Exceptional 87.8% |
| Immigrants | Saudi Arabia | 99.0 /100 | #69 | Exceptional 87.8% |
| Ukrainians | 98.8 /100 | #70 | Exceptional 87.7% |
| Austrians | 98.8 /100 | #71 | Exceptional 87.7% |
| Immigrants | Moldova | 98.8 /100 | #72 | Exceptional 87.7% |
| Belgians | 98.8 /100 | #73 | Exceptional 87.7% |
| Immigrants | Kuwait | 98.8 /100 | #74 | Exceptional 87.7% |
| Scottish | 98.7 /100 | #75 | Exceptional 87.7% |
| Immigrants | Serbia | 98.7 /100 | #76 | Exceptional 87.7% |
| Slavs | 98.7 /100 | #77 | Exceptional 87.7% |
| Irish | 98.6 /100 | #78 | Exceptional 87.6% |
| English | 98.6 /100 | #79 | Exceptional 87.6% |