Immigrants from Cambodia vs Hawaiian GED/Equivalency
COMPARE
Immigrants from Cambodia
Hawaiian
GED/Equivalency
GED/Equivalency Comparison
Immigrants from Cambodia
Hawaiians
82.2%
GED/EQUIVALENCY
0.0/ 100
METRIC RATING
289th/ 347
METRIC RANK
85.0%
GED/EQUIVALENCY
15.2/ 100
METRIC RATING
204th/ 347
METRIC RANK
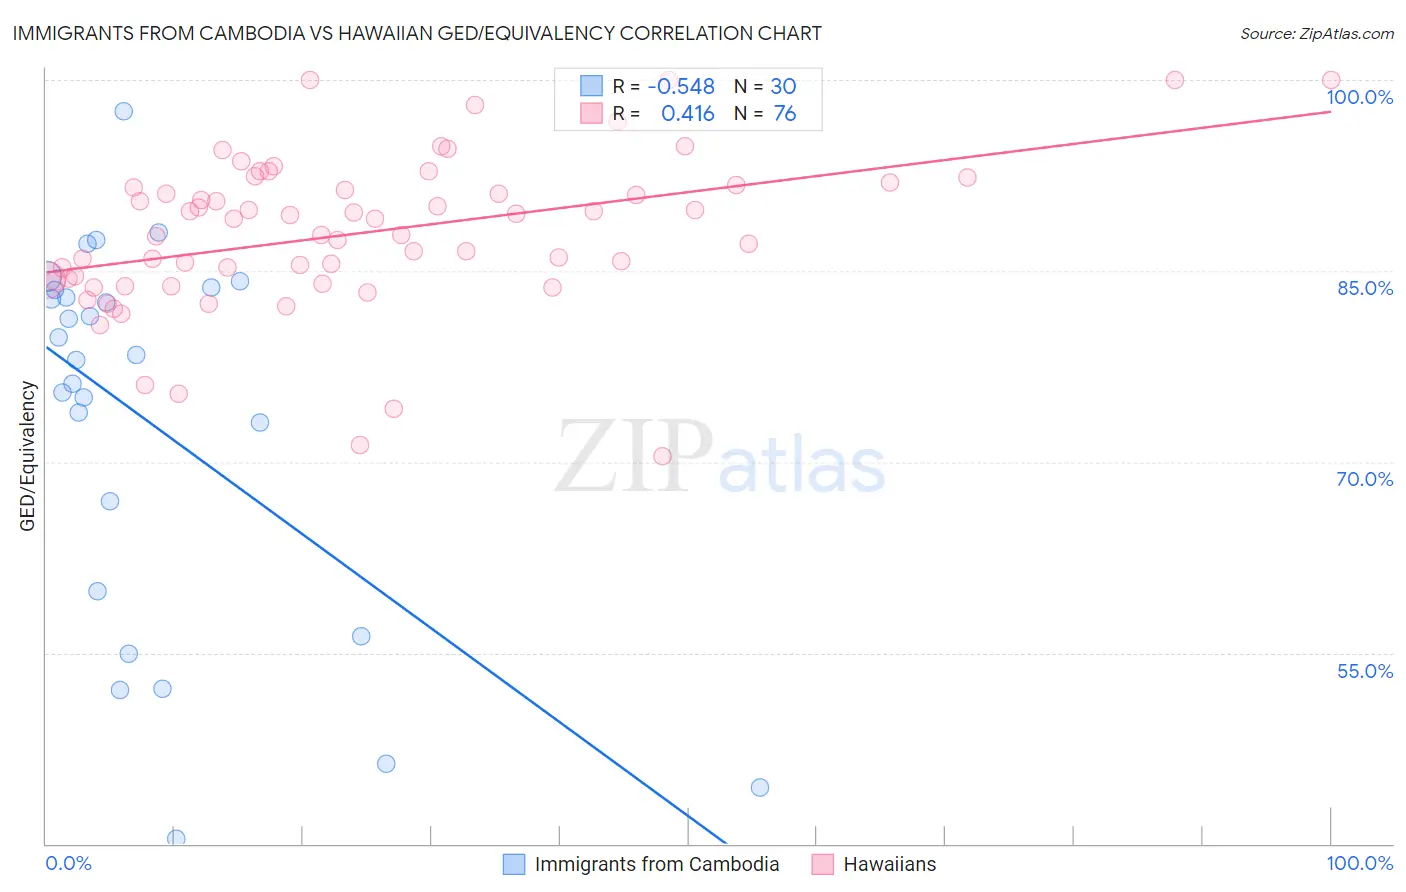
Immigrants from Cambodia vs Hawaiian GED/Equivalency Correlation Chart
The statistical analysis conducted on geographies consisting of 205,153,442 people shows a substantial negative correlation between the proportion of Immigrants from Cambodia and percentage of population with at least ged/equivalency education in the United States with a correlation coefficient (R) of -0.548 and weighted average of 82.2%. Similarly, the statistical analysis conducted on geographies consisting of 327,620,955 people shows a moderate positive correlation between the proportion of Hawaiians and percentage of population with at least ged/equivalency education in the United States with a correlation coefficient (R) of 0.416 and weighted average of 85.0%, a difference of 3.4%.
GED/Equivalency Correlation Summary
| Measurement | Immigrants from Cambodia | Hawaiian |
| Minimum | 40.4% | 70.4% |
| Maximum | 97.5% | 100.0% |
| Range | 57.1% | 29.6% |
| Mean | 73.0% | 87.9% |
| Median | 78.2% | 88.5% |
| Interquartile 25% (IQ1) | 59.8% | 84.3% |
| Interquartile 75% (IQ3) | 83.5% | 91.7% |
| Interquartile Range (IQR) | 23.7% | 7.4% |
| Standard Deviation (Sample) | 15.0% | 6.1% |
| Standard Deviation (Population) | 14.8% | 6.0% |
Similar Demographics by GED/Equivalency
Demographics Similar to Immigrants from Cambodia by GED/Equivalency
In terms of ged/equivalency, the demographic groups most similar to Immigrants from Cambodia are Pueblo (82.3%, a difference of 0.080%), Japanese (82.4%, a difference of 0.18%), Immigrants from West Indies (82.4%, a difference of 0.19%), Haitian (82.1%, a difference of 0.19%), and Cajun (82.4%, a difference of 0.22%).
| Demographics | Rating | Rank | GED/Equivalency |
| Immigrants | Immigrants | 0.1 /100 | #282 | Tragic 82.6% |
| Indonesians | 0.1 /100 | #283 | Tragic 82.5% |
| Immigrants | Barbados | 0.1 /100 | #284 | Tragic 82.4% |
| Cajuns | 0.0 /100 | #285 | Tragic 82.4% |
| Immigrants | West Indies | 0.0 /100 | #286 | Tragic 82.4% |
| Japanese | 0.0 /100 | #287 | Tragic 82.4% |
| Pueblo | 0.0 /100 | #288 | Tragic 82.3% |
| Immigrants | Cambodia | 0.0 /100 | #289 | Tragic 82.2% |
| Haitians | 0.0 /100 | #290 | Tragic 82.1% |
| Cubans | 0.0 /100 | #291 | Tragic 82.0% |
| Paiute | 0.0 /100 | #292 | Tragic 82.0% |
| British West Indians | 0.0 /100 | #293 | Tragic 82.0% |
| Immigrants | St. Vincent and the Grenadines | 0.0 /100 | #294 | Tragic 82.0% |
| Nepalese | 0.0 /100 | #295 | Tragic 81.9% |
| Vietnamese | 0.0 /100 | #296 | Tragic 81.9% |
Demographics Similar to Hawaiians by GED/Equivalency
In terms of ged/equivalency, the demographic groups most similar to Hawaiians are Panamanian (85.0%, a difference of 0.0%), Uruguayan (85.0%, a difference of 0.030%), Portuguese (85.0%, a difference of 0.030%), Cree (85.0%, a difference of 0.030%), and Liberian (85.0%, a difference of 0.030%).
| Demographics | Rating | Rank | GED/Equivalency |
| Costa Ricans | 20.4 /100 | #197 | Fair 85.2% |
| Immigrants | Africa | 17.5 /100 | #198 | Poor 85.1% |
| Somalis | 16.4 /100 | #199 | Poor 85.0% |
| Uruguayans | 16.0 /100 | #200 | Poor 85.0% |
| Portuguese | 15.9 /100 | #201 | Poor 85.0% |
| Cree | 15.9 /100 | #202 | Poor 85.0% |
| Panamanians | 15.3 /100 | #203 | Poor 85.0% |
| Hawaiians | 15.2 /100 | #204 | Poor 85.0% |
| Liberians | 14.6 /100 | #205 | Poor 85.0% |
| Samoans | 13.7 /100 | #206 | Poor 84.9% |
| Hmong | 13.1 /100 | #207 | Poor 84.9% |
| Marshallese | 12.5 /100 | #208 | Poor 84.9% |
| Colombians | 12.3 /100 | #209 | Poor 84.9% |
| Immigrants | Cameroon | 12.1 /100 | #210 | Poor 84.9% |
| South Americans | 10.9 /100 | #211 | Poor 84.8% |