Immigrants from Cambodia vs Nepalese GED/Equivalency
COMPARE
Immigrants from Cambodia
Nepalese
GED/Equivalency
GED/Equivalency Comparison
Immigrants from Cambodia
Nepalese
82.2%
GED/EQUIVALENCY
0.0/ 100
METRIC RATING
289th/ 347
METRIC RANK
81.9%
GED/EQUIVALENCY
0.0/ 100
METRIC RATING
295th/ 347
METRIC RANK
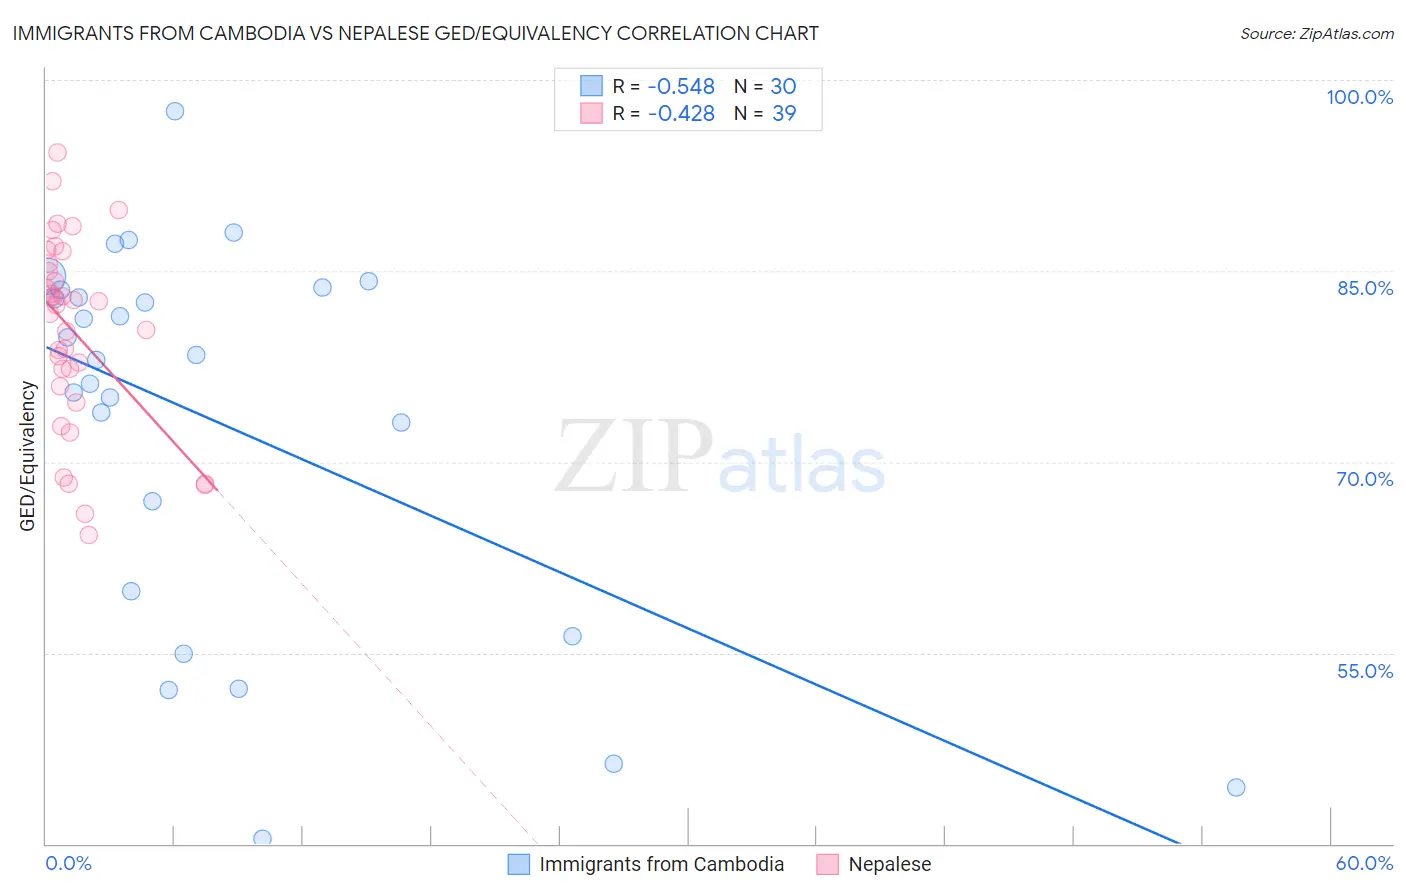
Immigrants from Cambodia vs Nepalese GED/Equivalency Correlation Chart
The statistical analysis conducted on geographies consisting of 205,153,442 people shows a substantial negative correlation between the proportion of Immigrants from Cambodia and percentage of population with at least ged/equivalency education in the United States with a correlation coefficient (R) of -0.548 and weighted average of 82.2%. Similarly, the statistical analysis conducted on geographies consisting of 24,519,269 people shows a moderate negative correlation between the proportion of Nepalese and percentage of population with at least ged/equivalency education in the United States with a correlation coefficient (R) of -0.428 and weighted average of 81.9%, a difference of 0.35%.
GED/Equivalency Correlation Summary
| Measurement | Immigrants from Cambodia | Nepalese |
| Minimum | 40.4% | 64.2% |
| Maximum | 97.5% | 94.3% |
| Range | 57.1% | 30.1% |
| Mean | 73.0% | 80.3% |
| Median | 78.2% | 82.3% |
| Interquartile 25% (IQ1) | 59.8% | 75.9% |
| Interquartile 75% (IQ3) | 83.5% | 85.5% |
| Interquartile Range (IQR) | 23.7% | 9.6% |
| Standard Deviation (Sample) | 15.0% | 7.4% |
| Standard Deviation (Population) | 14.8% | 7.4% |
Demographics Similar to Immigrants from Cambodia and Nepalese by GED/Equivalency
In terms of ged/equivalency, the demographic groups most similar to Immigrants from Cambodia are Pueblo (82.3%, a difference of 0.080%), Japanese (82.4%, a difference of 0.18%), Immigrants from West Indies (82.4%, a difference of 0.19%), Haitian (82.1%, a difference of 0.19%), and Cajun (82.4%, a difference of 0.22%). Similarly, the demographic groups most similar to Nepalese are Vietnamese (81.9%, a difference of 0.030%), Immigrants from St. Vincent and the Grenadines (82.0%, a difference of 0.060%), Immigrants from Bangladesh (81.9%, a difference of 0.070%), British West Indian (82.0%, a difference of 0.080%), and Paiute (82.0%, a difference of 0.090%).
| Demographics | Rating | Rank | GED/Equivalency |
| Immigrants | Immigrants | 0.1 /100 | #282 | Tragic 82.6% |
| Indonesians | 0.1 /100 | #283 | Tragic 82.5% |
| Immigrants | Barbados | 0.1 /100 | #284 | Tragic 82.4% |
| Cajuns | 0.0 /100 | #285 | Tragic 82.4% |
| Immigrants | West Indies | 0.0 /100 | #286 | Tragic 82.4% |
| Japanese | 0.0 /100 | #287 | Tragic 82.4% |
| Pueblo | 0.0 /100 | #288 | Tragic 82.3% |
| Immigrants | Cambodia | 0.0 /100 | #289 | Tragic 82.2% |
| Haitians | 0.0 /100 | #290 | Tragic 82.1% |
| Cubans | 0.0 /100 | #291 | Tragic 82.0% |
| Paiute | 0.0 /100 | #292 | Tragic 82.0% |
| British West Indians | 0.0 /100 | #293 | Tragic 82.0% |
| Immigrants | St. Vincent and the Grenadines | 0.0 /100 | #294 | Tragic 82.0% |
| Nepalese | 0.0 /100 | #295 | Tragic 81.9% |
| Vietnamese | 0.0 /100 | #296 | Tragic 81.9% |
| Immigrants | Bangladesh | 0.0 /100 | #297 | Tragic 81.9% |
| Ute | 0.0 /100 | #298 | Tragic 81.8% |
| Ecuadorians | 0.0 /100 | #299 | Tragic 81.7% |
| Fijians | 0.0 /100 | #300 | Tragic 81.6% |
| Dutch West Indians | 0.0 /100 | #301 | Tragic 81.6% |
| Immigrants | Haiti | 0.0 /100 | #302 | Tragic 81.6% |