Cajun vs Belizean High School Diploma
COMPARE
Cajun
Belizean
High School Diploma
High School Diploma Comparison
Cajuns
Belizeans
87.3%
HIGH SCHOOL DIPLOMA
0.4/ 100
METRIC RATING
260th/ 347
METRIC RANK
84.3%
HIGH SCHOOL DIPLOMA
0.0/ 100
METRIC RATING
316th/ 347
METRIC RANK
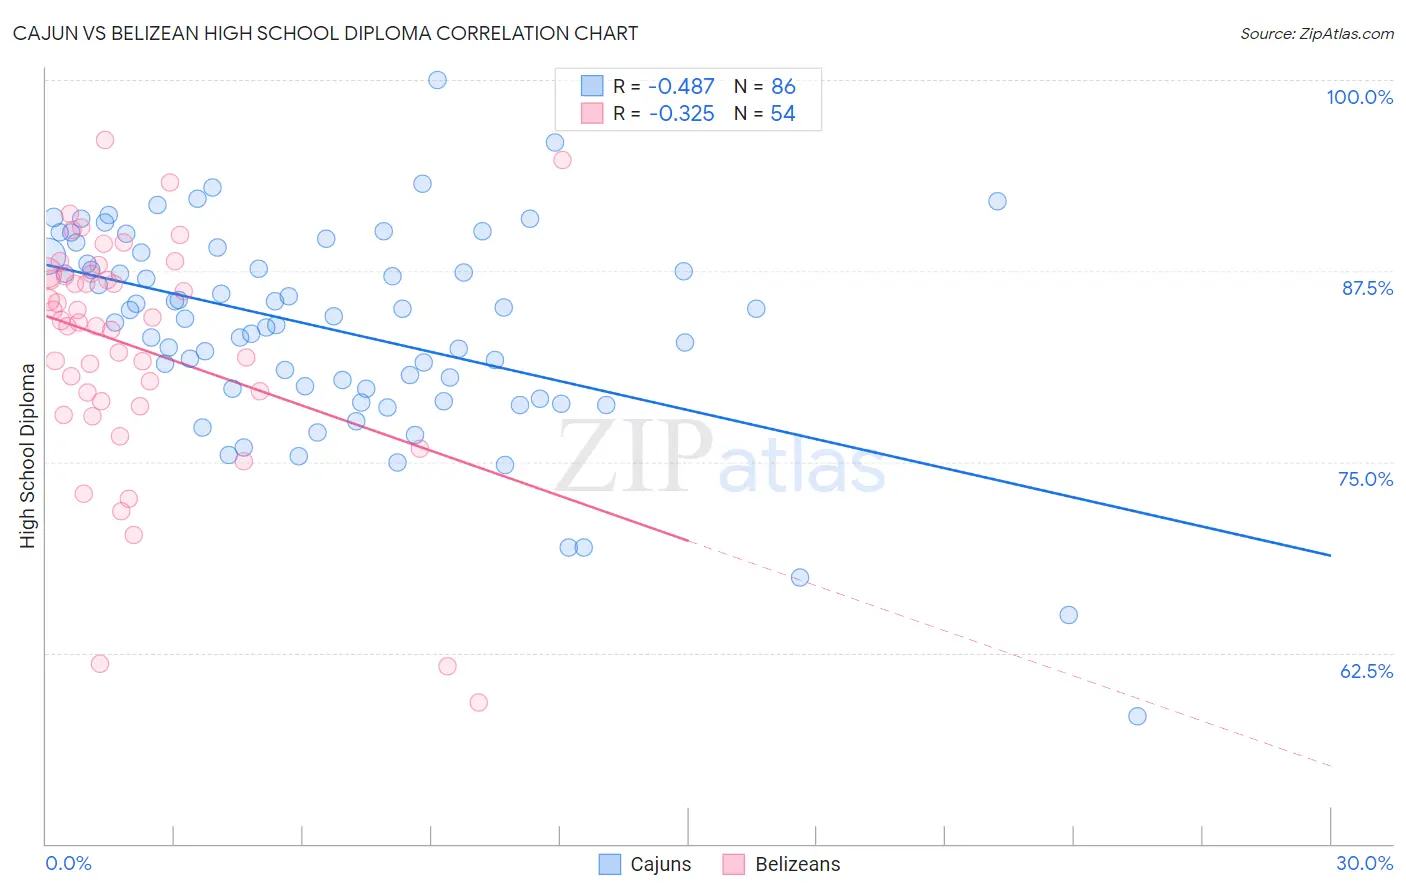
Cajun vs Belizean High School Diploma Correlation Chart
The statistical analysis conducted on geographies consisting of 149,713,149 people shows a moderate negative correlation between the proportion of Cajuns and percentage of population with at least high school diploma education in the United States with a correlation coefficient (R) of -0.487 and weighted average of 87.3%. Similarly, the statistical analysis conducted on geographies consisting of 144,225,006 people shows a mild negative correlation between the proportion of Belizeans and percentage of population with at least high school diploma education in the United States with a correlation coefficient (R) of -0.325 and weighted average of 84.3%, a difference of 3.5%.
High School Diploma Correlation Summary
| Measurement | Cajun | Belizean |
| Minimum | 58.4% | 59.3% |
| Maximum | 100.0% | 96.1% |
| Range | 41.6% | 36.8% |
| Mean | 83.6% | 82.5% |
| Median | 84.5% | 84.2% |
| Interquartile 25% (IQ1) | 79.8% | 79.0% |
| Interquartile 75% (IQ3) | 88.4% | 87.3% |
| Interquartile Range (IQR) | 8.7% | 8.3% |
| Standard Deviation (Sample) | 6.9% | 7.8% |
| Standard Deviation (Population) | 6.8% | 7.7% |
Similar Demographics by High School Diploma
Demographics Similar to Cajuns by High School Diploma
In terms of high school diploma, the demographic groups most similar to Cajuns are Seminole (87.3%, a difference of 0.020%), Immigrants from Peru (87.3%, a difference of 0.050%), Immigrants from Ghana (87.4%, a difference of 0.080%), Immigrants from Western Africa (87.4%, a difference of 0.080%), and Immigrants from South Eastern Asia (87.2%, a difference of 0.080%).
| Demographics | Rating | Rank | High School Diploma |
| Immigrants | Uruguay | 1.0 /100 | #253 | Tragic 87.6% |
| Immigrants | Colombia | 1.0 /100 | #254 | Tragic 87.6% |
| Immigrants | Senegal | 0.9 /100 | #255 | Tragic 87.6% |
| Africans | 0.7 /100 | #256 | Tragic 87.5% |
| Bahamians | 0.7 /100 | #257 | Tragic 87.5% |
| Immigrants | Ghana | 0.5 /100 | #258 | Tragic 87.4% |
| Immigrants | Western Africa | 0.5 /100 | #259 | Tragic 87.4% |
| Cajuns | 0.4 /100 | #260 | Tragic 87.3% |
| Seminole | 0.4 /100 | #261 | Tragic 87.3% |
| Immigrants | Peru | 0.4 /100 | #262 | Tragic 87.3% |
| Immigrants | South Eastern Asia | 0.3 /100 | #263 | Tragic 87.2% |
| Jamaicans | 0.3 /100 | #264 | Tragic 87.2% |
| U.S. Virgin Islanders | 0.2 /100 | #265 | Tragic 87.1% |
| Immigrants | Congo | 0.2 /100 | #266 | Tragic 87.0% |
| Blacks/African Americans | 0.2 /100 | #267 | Tragic 87.0% |
Demographics Similar to Belizeans by High School Diploma
In terms of high school diploma, the demographic groups most similar to Belizeans are Immigrants from Caribbean (84.3%, a difference of 0.060%), Immigrants from Belize (84.2%, a difference of 0.13%), Central American Indian (84.2%, a difference of 0.16%), Nicaraguan (84.1%, a difference of 0.26%), and Puerto Rican (84.7%, a difference of 0.40%).
| Demographics | Rating | Rank | High School Diploma |
| Immigrants | Dominica | 0.0 /100 | #309 | Tragic 85.2% |
| Apache | 0.0 /100 | #310 | Tragic 85.1% |
| Ecuadorians | 0.0 /100 | #311 | Tragic 85.1% |
| Cape Verdeans | 0.0 /100 | #312 | Tragic 85.1% |
| Immigrants | Ecuador | 0.0 /100 | #313 | Tragic 84.8% |
| Yaqui | 0.0 /100 | #314 | Tragic 84.7% |
| Puerto Ricans | 0.0 /100 | #315 | Tragic 84.7% |
| Belizeans | 0.0 /100 | #316 | Tragic 84.3% |
| Immigrants | Caribbean | 0.0 /100 | #317 | Tragic 84.3% |
| Immigrants | Belize | 0.0 /100 | #318 | Tragic 84.2% |
| Central American Indians | 0.0 /100 | #319 | Tragic 84.2% |
| Nicaraguans | 0.0 /100 | #320 | Tragic 84.1% |
| Yuman | 0.0 /100 | #321 | Tragic 84.0% |
| Lumbee | 0.0 /100 | #322 | Tragic 83.6% |
| Immigrants | Cuba | 0.0 /100 | #323 | Tragic 83.5% |