Jordanian vs Belizean High School Diploma
COMPARE
Jordanian
Belizean
High School Diploma
High School Diploma Comparison
Jordanians
Belizeans
90.2%
HIGH SCHOOL DIPLOMA
95.4/ 100
METRIC RATING
117th/ 347
METRIC RANK
84.3%
HIGH SCHOOL DIPLOMA
0.0/ 100
METRIC RATING
316th/ 347
METRIC RANK
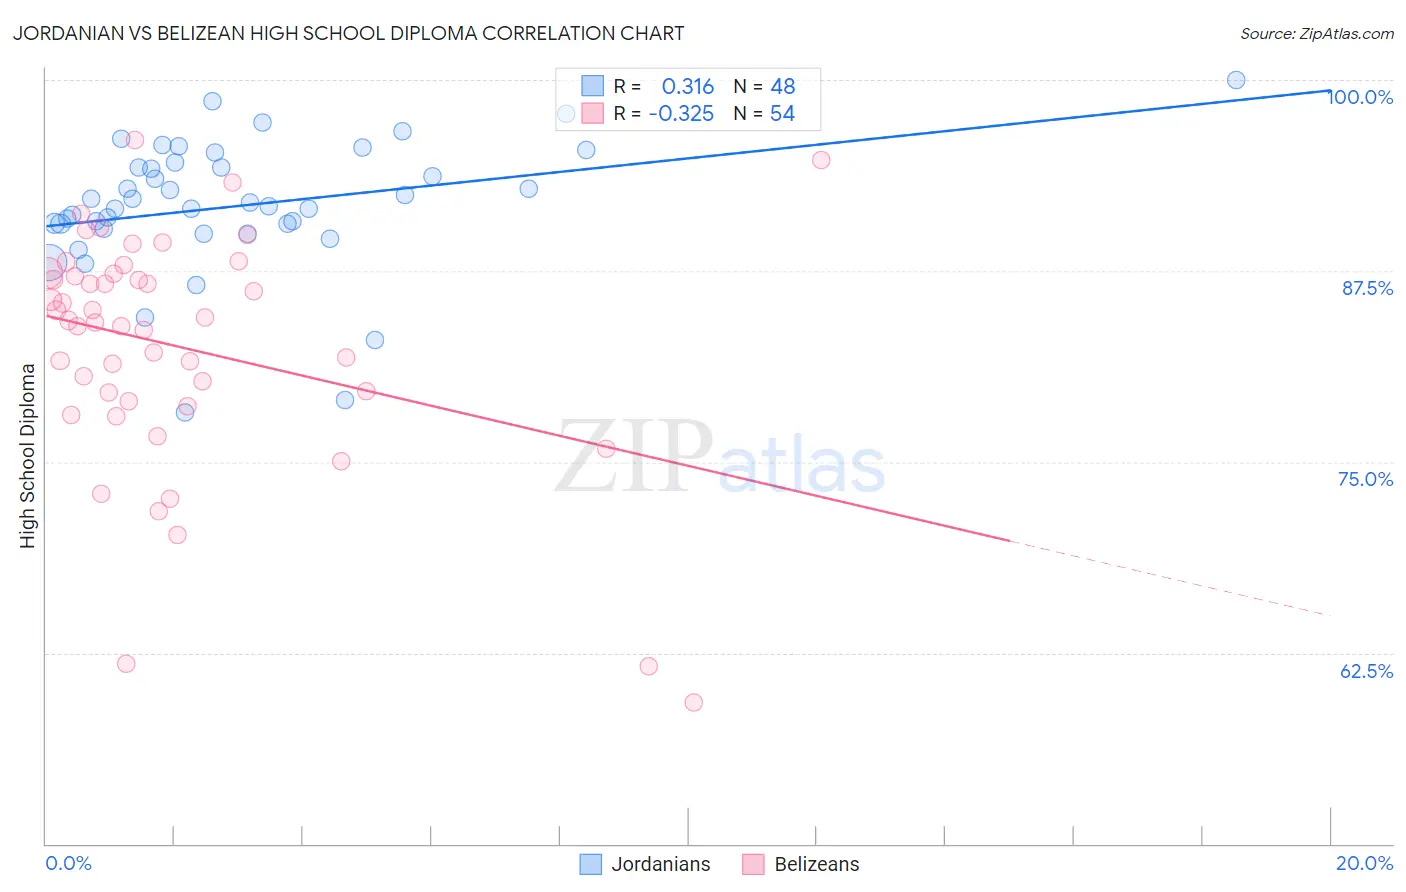
Jordanian vs Belizean High School Diploma Correlation Chart
The statistical analysis conducted on geographies consisting of 166,423,935 people shows a mild positive correlation between the proportion of Jordanians and percentage of population with at least high school diploma education in the United States with a correlation coefficient (R) of 0.316 and weighted average of 90.2%. Similarly, the statistical analysis conducted on geographies consisting of 144,225,006 people shows a mild negative correlation between the proportion of Belizeans and percentage of population with at least high school diploma education in the United States with a correlation coefficient (R) of -0.325 and weighted average of 84.3%, a difference of 6.9%.
High School Diploma Correlation Summary
| Measurement | Jordanian | Belizean |
| Minimum | 78.2% | 59.3% |
| Maximum | 100.0% | 96.1% |
| Range | 21.8% | 36.8% |
| Mean | 91.8% | 82.5% |
| Median | 91.9% | 84.2% |
| Interquartile 25% (IQ1) | 90.4% | 79.0% |
| Interquartile 75% (IQ3) | 94.5% | 87.3% |
| Interquartile Range (IQR) | 4.1% | 8.3% |
| Standard Deviation (Sample) | 4.4% | 7.8% |
| Standard Deviation (Population) | 4.3% | 7.7% |
Similar Demographics by High School Diploma
Demographics Similar to Jordanians by High School Diploma
In terms of high school diploma, the demographic groups most similar to Jordanians are Israeli (90.1%, a difference of 0.020%), Immigrants from Germany (90.2%, a difference of 0.030%), Immigrants from Hungary (90.2%, a difference of 0.040%), Immigrants from Eastern Europe (90.1%, a difference of 0.040%), and Ottawa (90.1%, a difference of 0.070%).
| Demographics | Rating | Rank | High School Diploma |
| Immigrants | Greece | 96.6 /100 | #110 | Exceptional 90.3% |
| Menominee | 96.6 /100 | #111 | Exceptional 90.3% |
| Immigrants | Belarus | 96.4 /100 | #112 | Exceptional 90.2% |
| Immigrants | Sri Lanka | 96.3 /100 | #113 | Exceptional 90.2% |
| Yugoslavians | 96.2 /100 | #114 | Exceptional 90.2% |
| Immigrants | Hungary | 95.8 /100 | #115 | Exceptional 90.2% |
| Immigrants | Germany | 95.7 /100 | #116 | Exceptional 90.2% |
| Jordanians | 95.4 /100 | #117 | Exceptional 90.2% |
| Israelis | 95.1 /100 | #118 | Exceptional 90.1% |
| Immigrants | Eastern Europe | 94.9 /100 | #119 | Exceptional 90.1% |
| Ottawa | 94.4 /100 | #120 | Exceptional 90.1% |
| Whites/Caucasians | 94.1 /100 | #121 | Exceptional 90.1% |
| Immigrants | Kazakhstan | 93.4 /100 | #122 | Exceptional 90.0% |
| German Russians | 92.0 /100 | #123 | Exceptional 90.0% |
| Mongolians | 91.6 /100 | #124 | Exceptional 89.9% |
Demographics Similar to Belizeans by High School Diploma
In terms of high school diploma, the demographic groups most similar to Belizeans are Immigrants from Caribbean (84.3%, a difference of 0.060%), Immigrants from Belize (84.2%, a difference of 0.13%), Central American Indian (84.2%, a difference of 0.16%), Nicaraguan (84.1%, a difference of 0.26%), and Puerto Rican (84.7%, a difference of 0.40%).
| Demographics | Rating | Rank | High School Diploma |
| Immigrants | Dominica | 0.0 /100 | #309 | Tragic 85.2% |
| Apache | 0.0 /100 | #310 | Tragic 85.1% |
| Ecuadorians | 0.0 /100 | #311 | Tragic 85.1% |
| Cape Verdeans | 0.0 /100 | #312 | Tragic 85.1% |
| Immigrants | Ecuador | 0.0 /100 | #313 | Tragic 84.8% |
| Yaqui | 0.0 /100 | #314 | Tragic 84.7% |
| Puerto Ricans | 0.0 /100 | #315 | Tragic 84.7% |
| Belizeans | 0.0 /100 | #316 | Tragic 84.3% |
| Immigrants | Caribbean | 0.0 /100 | #317 | Tragic 84.3% |
| Immigrants | Belize | 0.0 /100 | #318 | Tragic 84.2% |
| Central American Indians | 0.0 /100 | #319 | Tragic 84.2% |
| Nicaraguans | 0.0 /100 | #320 | Tragic 84.1% |
| Yuman | 0.0 /100 | #321 | Tragic 84.0% |
| Lumbee | 0.0 /100 | #322 | Tragic 83.6% |
| Immigrants | Cuba | 0.0 /100 | #323 | Tragic 83.5% |