Immigrants from Burma/Myanmar vs Belizean 9th Grade
COMPARE
Immigrants from Burma/Myanmar
Belizean
9th Grade
9th Grade Comparison
Immigrants from Burma/Myanmar
Belizeans
93.1%
9TH GRADE
0.0/ 100
METRIC RATING
295th/ 347
METRIC RANK
91.8%
9TH GRADE
0.0/ 100
METRIC RATING
322nd/ 347
METRIC RANK
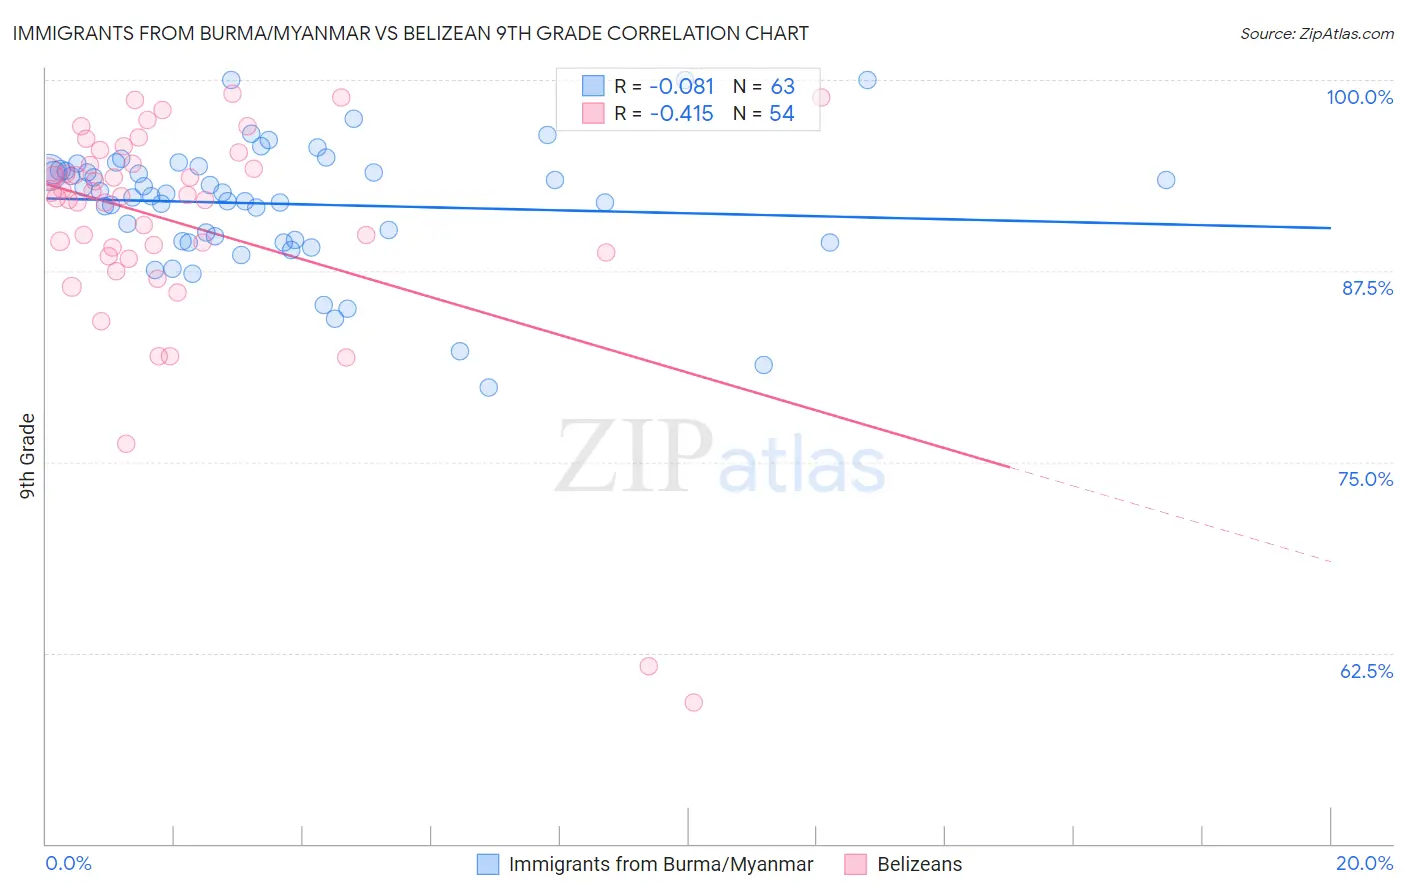
Immigrants from Burma/Myanmar vs Belizean 9th Grade Correlation Chart
The statistical analysis conducted on geographies consisting of 172,345,696 people shows a slight negative correlation between the proportion of Immigrants from Burma/Myanmar and percentage of population with at least 9th grade education in the United States with a correlation coefficient (R) of -0.081 and weighted average of 93.1%. Similarly, the statistical analysis conducted on geographies consisting of 144,225,006 people shows a moderate negative correlation between the proportion of Belizeans and percentage of population with at least 9th grade education in the United States with a correlation coefficient (R) of -0.415 and weighted average of 91.8%, a difference of 1.5%.
9th Grade Correlation Summary
| Measurement | Immigrants from Burma/Myanmar | Belizean |
| Minimum | 79.9% | 59.3% |
| Maximum | 100.0% | 99.1% |
| Range | 20.1% | 39.8% |
| Mean | 91.9% | 90.6% |
| Median | 92.5% | 92.4% |
| Interquartile 25% (IQ1) | 89.4% | 88.7% |
| Interquartile 75% (IQ3) | 94.1% | 94.5% |
| Interquartile Range (IQR) | 4.6% | 5.9% |
| Standard Deviation (Sample) | 4.1% | 7.7% |
| Standard Deviation (Population) | 4.1% | 7.6% |
Similar Demographics by 9th Grade
Demographics Similar to Immigrants from Burma/Myanmar by 9th Grade
In terms of 9th grade, the demographic groups most similar to Immigrants from Burma/Myanmar are Indonesian (93.1%, a difference of 0.0%), Sri Lankan (93.2%, a difference of 0.020%), Cuban (93.2%, a difference of 0.020%), Fijian (93.1%, a difference of 0.030%), and Immigrants from Laos (93.2%, a difference of 0.040%).
| Demographics | Rating | Rank | 9th Grade |
| Immigrants | South Eastern Asia | 0.0 /100 | #288 | Tragic 93.3% |
| Immigrants | West Indies | 0.0 /100 | #289 | Tragic 93.3% |
| Pennsylvania Germans | 0.0 /100 | #290 | Tragic 93.3% |
| British West Indians | 0.0 /100 | #291 | Tragic 93.2% |
| Immigrants | Laos | 0.0 /100 | #292 | Tragic 93.2% |
| Sri Lankans | 0.0 /100 | #293 | Tragic 93.2% |
| Cubans | 0.0 /100 | #294 | Tragic 93.2% |
| Immigrants | Burma/Myanmar | 0.0 /100 | #295 | Tragic 93.1% |
| Indonesians | 0.0 /100 | #296 | Tragic 93.1% |
| Fijians | 0.0 /100 | #297 | Tragic 93.1% |
| Haitians | 0.0 /100 | #298 | Tragic 93.1% |
| Immigrants | Grenada | 0.0 /100 | #299 | Tragic 93.0% |
| Yaqui | 0.0 /100 | #300 | Tragic 92.9% |
| Immigrants | Haiti | 0.0 /100 | #301 | Tragic 92.7% |
| Immigrants | Dominica | 0.0 /100 | #302 | Tragic 92.7% |
Demographics Similar to Belizeans by 9th Grade
In terms of 9th grade, the demographic groups most similar to Belizeans are Puerto Rican (91.8%, a difference of 0.0%), Immigrants from Ecuador (91.8%, a difference of 0.030%), Immigrants from Belize (91.8%, a difference of 0.060%), Nicaraguan (91.9%, a difference of 0.090%), and Ecuadorian (91.9%, a difference of 0.13%).
| Demographics | Rating | Rank | 9th Grade |
| Immigrants | Caribbean | 0.0 /100 | #315 | Tragic 92.2% |
| Cape Verdeans | 0.0 /100 | #316 | Tragic 92.2% |
| Immigrants | Cuba | 0.0 /100 | #317 | Tragic 92.2% |
| Nepalese | 0.0 /100 | #318 | Tragic 92.0% |
| Ecuadorians | 0.0 /100 | #319 | Tragic 91.9% |
| Nicaraguans | 0.0 /100 | #320 | Tragic 91.9% |
| Immigrants | Ecuador | 0.0 /100 | #321 | Tragic 91.8% |
| Belizeans | 0.0 /100 | #322 | Tragic 91.8% |
| Puerto Ricans | 0.0 /100 | #323 | Tragic 91.8% |
| Immigrants | Belize | 0.0 /100 | #324 | Tragic 91.8% |
| Central American Indians | 0.0 /100 | #325 | Tragic 91.5% |
| Immigrants | Armenia | 0.0 /100 | #326 | Tragic 91.4% |
| Immigrants | Nicaragua | 0.0 /100 | #327 | Tragic 91.3% |
| Dominicans | 0.0 /100 | #328 | Tragic 91.1% |
| Hondurans | 0.0 /100 | #329 | Tragic 91.0% |