Haitian vs Belizean High School Diploma
COMPARE
Haitian
Belizean
High School Diploma
High School Diploma Comparison
Haitians
Belizeans
85.9%
HIGH SCHOOL DIPLOMA
0.0/ 100
METRIC RATING
291st/ 347
METRIC RANK
84.3%
HIGH SCHOOL DIPLOMA
0.0/ 100
METRIC RATING
316th/ 347
METRIC RANK
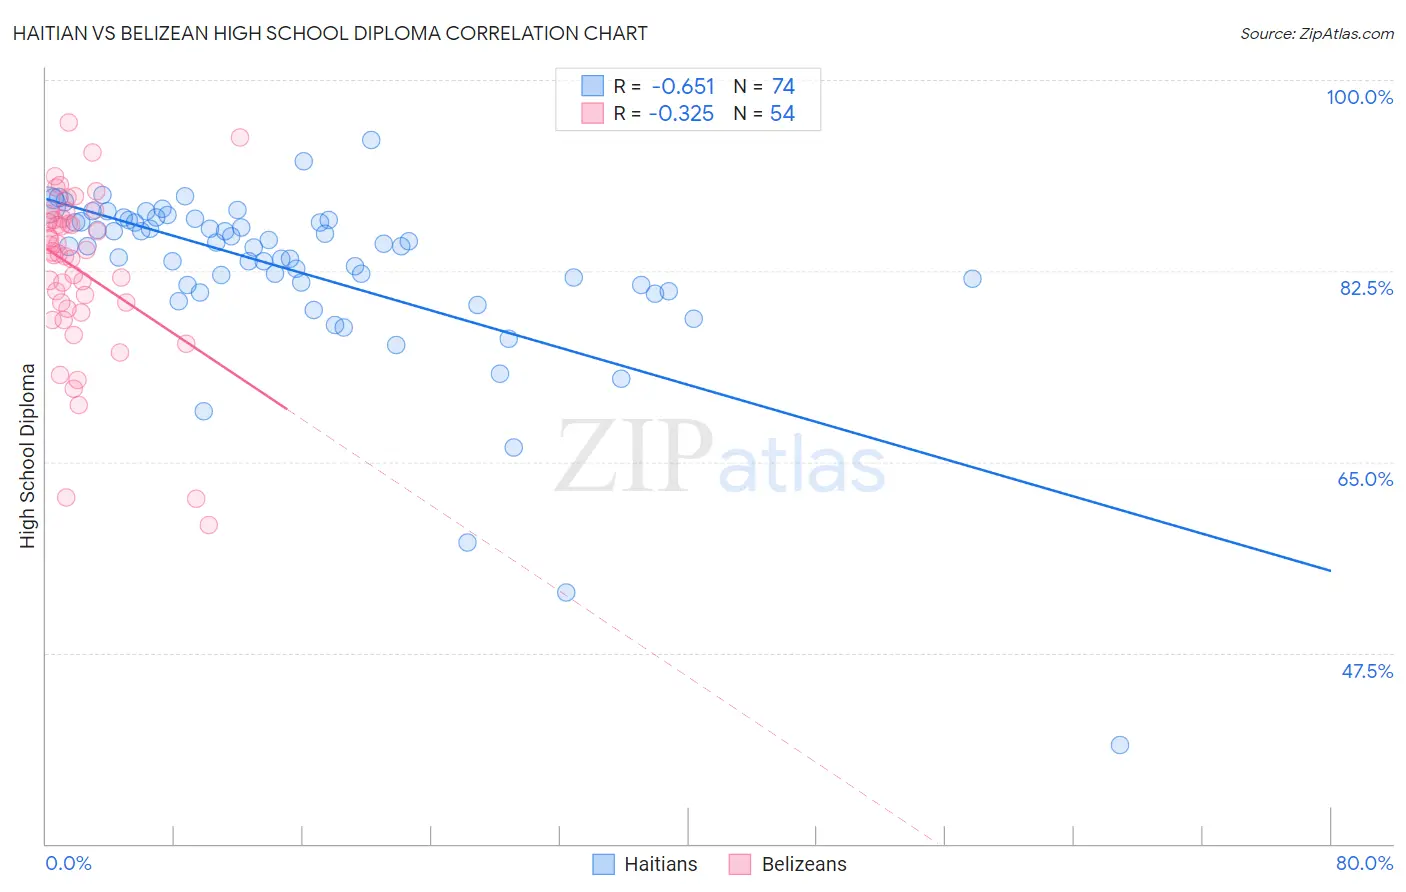
Haitian vs Belizean High School Diploma Correlation Chart
The statistical analysis conducted on geographies consisting of 288,018,742 people shows a significant negative correlation between the proportion of Haitians and percentage of population with at least high school diploma education in the United States with a correlation coefficient (R) of -0.651 and weighted average of 85.9%. Similarly, the statistical analysis conducted on geographies consisting of 144,225,006 people shows a mild negative correlation between the proportion of Belizeans and percentage of population with at least high school diploma education in the United States with a correlation coefficient (R) of -0.325 and weighted average of 84.3%, a difference of 1.8%.
High School Diploma Correlation Summary
| Measurement | Haitian | Belizean |
| Minimum | 39.0% | 59.3% |
| Maximum | 94.5% | 96.1% |
| Range | 55.5% | 36.8% |
| Mean | 82.5% | 82.5% |
| Median | 84.8% | 84.2% |
| Interquartile 25% (IQ1) | 81.2% | 79.0% |
| Interquartile 75% (IQ3) | 87.1% | 87.3% |
| Interquartile Range (IQR) | 5.9% | 8.3% |
| Standard Deviation (Sample) | 8.5% | 7.8% |
| Standard Deviation (Population) | 8.4% | 7.7% |
Similar Demographics by High School Diploma
Demographics Similar to Haitians by High School Diploma
In terms of high school diploma, the demographic groups most similar to Haitians are Japanese (85.9%, a difference of 0.0%), British West Indian (85.9%, a difference of 0.030%), Immigrants from Fiji (85.8%, a difference of 0.060%), Immigrants (85.8%, a difference of 0.080%), and Fijian (86.0%, a difference of 0.13%).
| Demographics | Rating | Rank | High School Diploma |
| Paiute | 0.0 /100 | #284 | Tragic 86.4% |
| Immigrants | West Indies | 0.0 /100 | #285 | Tragic 86.2% |
| Immigrants | St. Vincent and the Grenadines | 0.0 /100 | #286 | Tragic 86.2% |
| Ute | 0.0 /100 | #287 | Tragic 86.2% |
| Immigrants | Vietnam | 0.0 /100 | #288 | Tragic 86.2% |
| Yup'ik | 0.0 /100 | #289 | Tragic 86.1% |
| Fijians | 0.0 /100 | #290 | Tragic 86.0% |
| Haitians | 0.0 /100 | #291 | Tragic 85.9% |
| Japanese | 0.0 /100 | #292 | Tragic 85.9% |
| British West Indians | 0.0 /100 | #293 | Tragic 85.9% |
| Immigrants | Fiji | 0.0 /100 | #294 | Tragic 85.8% |
| Immigrants | Immigrants | 0.0 /100 | #295 | Tragic 85.8% |
| Immigrants | Cambodia | 0.0 /100 | #296 | Tragic 85.6% |
| Immigrants | Grenada | 0.0 /100 | #297 | Tragic 85.6% |
| Natives/Alaskans | 0.0 /100 | #298 | Tragic 85.6% |
Demographics Similar to Belizeans by High School Diploma
In terms of high school diploma, the demographic groups most similar to Belizeans are Immigrants from Caribbean (84.3%, a difference of 0.060%), Immigrants from Belize (84.2%, a difference of 0.13%), Central American Indian (84.2%, a difference of 0.16%), Nicaraguan (84.1%, a difference of 0.26%), and Puerto Rican (84.7%, a difference of 0.40%).
| Demographics | Rating | Rank | High School Diploma |
| Immigrants | Dominica | 0.0 /100 | #309 | Tragic 85.2% |
| Apache | 0.0 /100 | #310 | Tragic 85.1% |
| Ecuadorians | 0.0 /100 | #311 | Tragic 85.1% |
| Cape Verdeans | 0.0 /100 | #312 | Tragic 85.1% |
| Immigrants | Ecuador | 0.0 /100 | #313 | Tragic 84.8% |
| Yaqui | 0.0 /100 | #314 | Tragic 84.7% |
| Puerto Ricans | 0.0 /100 | #315 | Tragic 84.7% |
| Belizeans | 0.0 /100 | #316 | Tragic 84.3% |
| Immigrants | Caribbean | 0.0 /100 | #317 | Tragic 84.3% |
| Immigrants | Belize | 0.0 /100 | #318 | Tragic 84.2% |
| Central American Indians | 0.0 /100 | #319 | Tragic 84.2% |
| Nicaraguans | 0.0 /100 | #320 | Tragic 84.1% |
| Yuman | 0.0 /100 | #321 | Tragic 84.0% |
| Lumbee | 0.0 /100 | #322 | Tragic 83.6% |
| Immigrants | Cuba | 0.0 /100 | #323 | Tragic 83.5% |