Immigrants from Belgium vs Moroccan Family Households
COMPARE
Immigrants from Belgium
Moroccan
Family Households
Family Households Comparison
Immigrants from Belgium
Moroccans
63.0%
FAMILY HOUSEHOLDS
0.2/ 100
METRIC RATING
278th/ 347
METRIC RANK
61.9%
FAMILY HOUSEHOLDS
0.0/ 100
METRIC RATING
315th/ 347
METRIC RANK
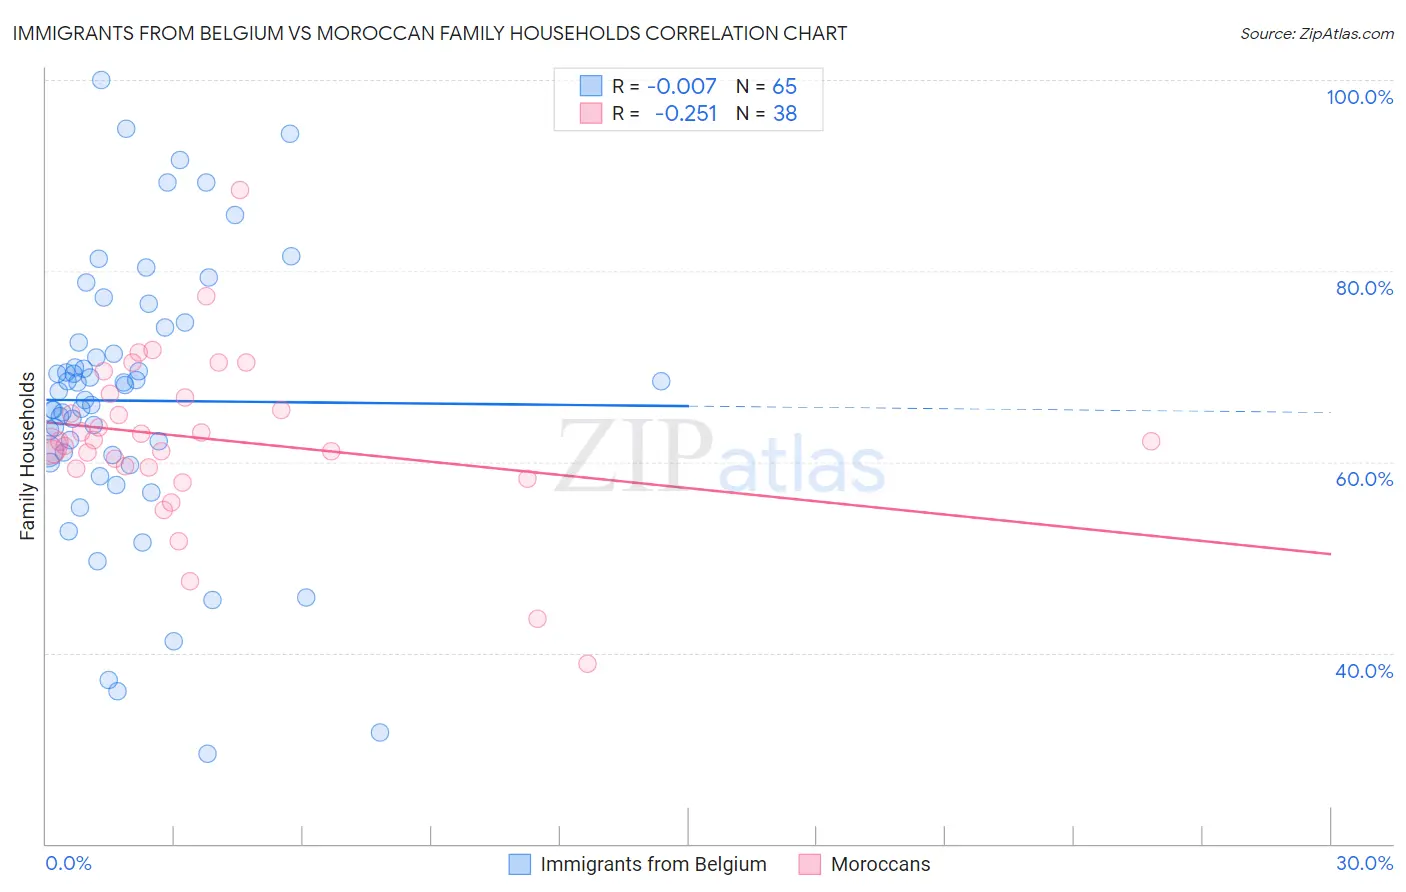
Immigrants from Belgium vs Moroccan Family Households Correlation Chart
The statistical analysis conducted on geographies consisting of 146,698,570 people shows no correlation between the proportion of Immigrants from Belgium and percentage of family households in the United States with a correlation coefficient (R) of -0.007 and weighted average of 63.0%. Similarly, the statistical analysis conducted on geographies consisting of 201,760,179 people shows a weak negative correlation between the proportion of Moroccans and percentage of family households in the United States with a correlation coefficient (R) of -0.251 and weighted average of 61.9%, a difference of 1.7%.
Family Households Correlation Summary
| Measurement | Immigrants from Belgium | Moroccan |
| Minimum | 29.4% | 38.9% |
| Maximum | 100.0% | 88.5% |
| Range | 70.6% | 49.6% |
| Mean | 66.4% | 62.4% |
| Median | 67.5% | 62.1% |
| Interquartile 25% (IQ1) | 60.4% | 59.3% |
| Interquartile 75% (IQ3) | 73.3% | 66.7% |
| Interquartile Range (IQR) | 12.9% | 7.4% |
| Standard Deviation (Sample) | 14.5% | 8.7% |
| Standard Deviation (Population) | 14.4% | 8.6% |
Similar Demographics by Family Households
Demographics Similar to Immigrants from Belgium by Family Households
In terms of family households, the demographic groups most similar to Immigrants from Belgium are Ottawa (63.0%, a difference of 0.040%), Immigrants from Yemen (63.0%, a difference of 0.040%), Immigrants from Bulgaria (63.0%, a difference of 0.050%), Serbian (63.0%, a difference of 0.090%), and Lumbee (63.1%, a difference of 0.10%).
| Demographics | Rating | Rank | Family Households |
| Immigrants | Croatia | 0.3 /100 | #271 | Tragic 63.1% |
| Immigrants | Turkey | 0.3 /100 | #272 | Tragic 63.1% |
| Immigrants | Kazakhstan | 0.3 /100 | #273 | Tragic 63.1% |
| Lumbee | 0.3 /100 | #274 | Tragic 63.1% |
| West Indians | 0.3 /100 | #275 | Tragic 63.1% |
| Serbians | 0.3 /100 | #276 | Tragic 63.0% |
| Ottawa | 0.3 /100 | #277 | Tragic 63.0% |
| Immigrants | Belgium | 0.2 /100 | #278 | Tragic 63.0% |
| Immigrants | Yemen | 0.2 /100 | #279 | Tragic 63.0% |
| Immigrants | Bulgaria | 0.2 /100 | #280 | Tragic 63.0% |
| Estonians | 0.2 /100 | #281 | Tragic 62.9% |
| New Zealanders | 0.1 /100 | #282 | Tragic 62.9% |
| Immigrants | Denmark | 0.1 /100 | #283 | Tragic 62.9% |
| Australians | 0.1 /100 | #284 | Tragic 62.8% |
| Mongolians | 0.1 /100 | #285 | Tragic 62.8% |
Demographics Similar to Moroccans by Family Households
In terms of family households, the demographic groups most similar to Moroccans are Immigrants from Cabo Verde (61.9%, a difference of 0.040%), Immigrants from Middle Africa (61.9%, a difference of 0.040%), Immigrants from Bosnia and Herzegovina (61.9%, a difference of 0.080%), Liberian (62.0%, a difference of 0.090%), and Immigrants from Latvia (62.0%, a difference of 0.10%).
| Demographics | Rating | Rank | Family Households |
| Chippewa | 0.0 /100 | #308 | Tragic 62.1% |
| Sub-Saharan Africans | 0.0 /100 | #309 | Tragic 62.1% |
| Immigrants | Liberia | 0.0 /100 | #310 | Tragic 62.0% |
| Immigrants | Morocco | 0.0 /100 | #311 | Tragic 62.0% |
| Immigrants | Latvia | 0.0 /100 | #312 | Tragic 62.0% |
| Liberians | 0.0 /100 | #313 | Tragic 62.0% |
| Immigrants | Cabo Verde | 0.0 /100 | #314 | Tragic 61.9% |
| Moroccans | 0.0 /100 | #315 | Tragic 61.9% |
| Immigrants | Middle Africa | 0.0 /100 | #316 | Tragic 61.9% |
| Immigrants | Bosnia and Herzegovina | 0.0 /100 | #317 | Tragic 61.9% |
| Alaskan Athabascans | 0.0 /100 | #318 | Tragic 61.8% |
| Cape Verdeans | 0.0 /100 | #319 | Tragic 61.8% |
| Ugandans | 0.0 /100 | #320 | Tragic 61.7% |
| Alsatians | 0.0 /100 | #321 | Tragic 61.7% |
| Immigrants | Serbia | 0.0 /100 | #322 | Tragic 61.6% |