Ute vs Moroccan GED/Equivalency
COMPARE
Ute
Moroccan
GED/Equivalency
GED/Equivalency Comparison
Ute
Moroccans
81.8%
GED/EQUIVALENCY
0.0/ 100
METRIC RATING
298th/ 347
METRIC RANK
85.5%
GED/EQUIVALENCY
37.7/ 100
METRIC RATING
181st/ 347
METRIC RANK
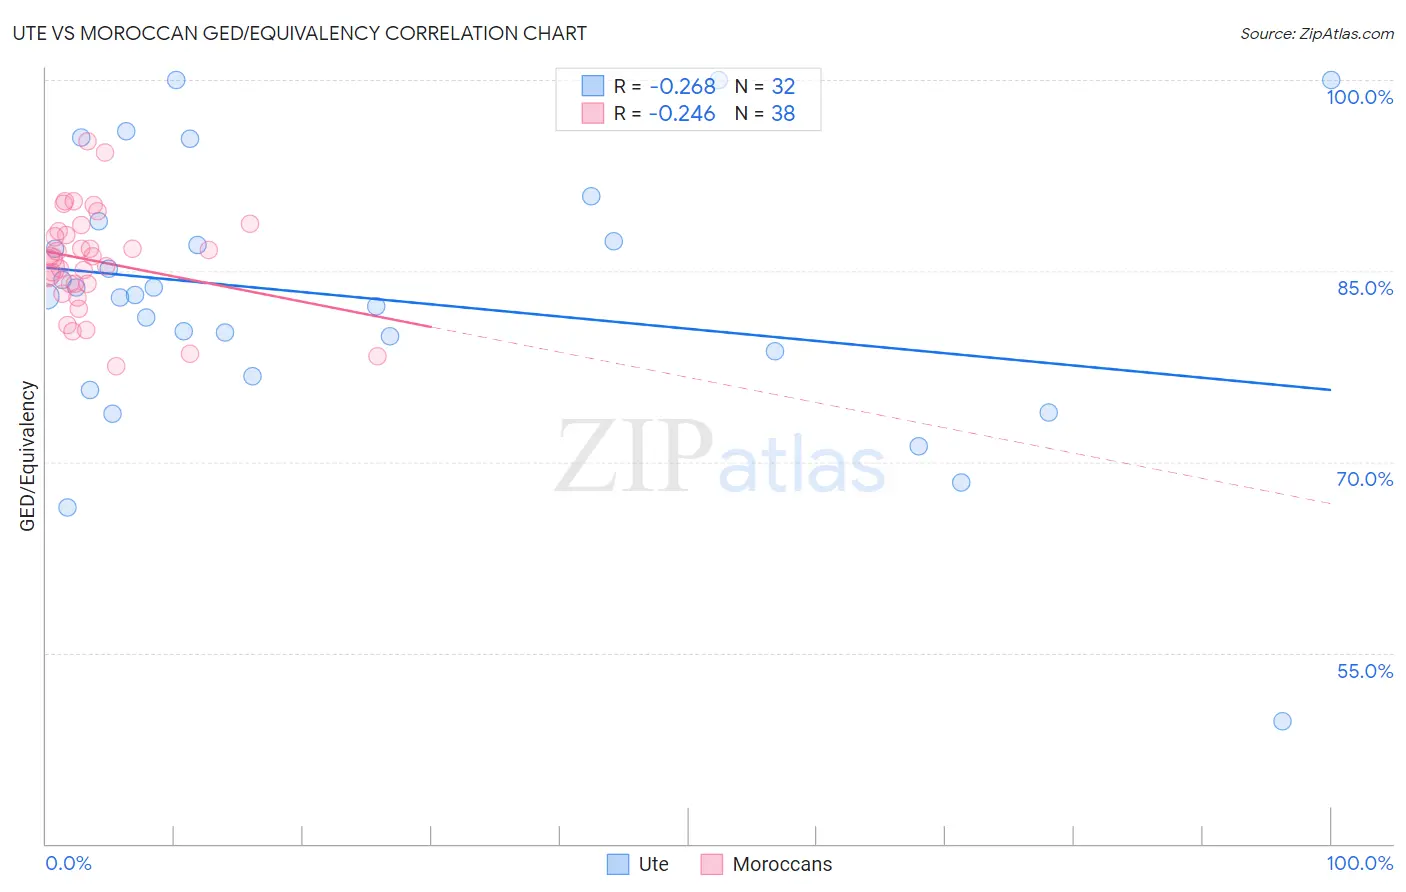
Ute vs Moroccan GED/Equivalency Correlation Chart
The statistical analysis conducted on geographies consisting of 55,668,599 people shows a weak negative correlation between the proportion of Ute and percentage of population with at least ged/equivalency education in the United States with a correlation coefficient (R) of -0.268 and weighted average of 81.8%. Similarly, the statistical analysis conducted on geographies consisting of 201,817,353 people shows a weak negative correlation between the proportion of Moroccans and percentage of population with at least ged/equivalency education in the United States with a correlation coefficient (R) of -0.246 and weighted average of 85.5%, a difference of 4.6%.
GED/Equivalency Correlation Summary
| Measurement | Ute | Moroccan |
| Minimum | 49.6% | 77.5% |
| Maximum | 100.0% | 95.2% |
| Range | 50.4% | 17.7% |
| Mean | 82.9% | 85.8% |
| Median | 83.0% | 86.1% |
| Interquartile 25% (IQ1) | 77.7% | 84.0% |
| Interquartile 75% (IQ3) | 88.1% | 88.2% |
| Interquartile Range (IQR) | 10.4% | 4.2% |
| Standard Deviation (Sample) | 10.7% | 4.0% |
| Standard Deviation (Population) | 10.5% | 4.0% |
Similar Demographics by GED/Equivalency
Demographics Similar to Ute by GED/Equivalency
In terms of ged/equivalency, the demographic groups most similar to Ute are Immigrants from Bangladesh (81.9%, a difference of 0.090%), Vietnamese (81.9%, a difference of 0.14%), Ecuadorian (81.7%, a difference of 0.14%), Nepalese (81.9%, a difference of 0.17%), and Fijian (81.6%, a difference of 0.20%).
| Demographics | Rating | Rank | GED/Equivalency |
| Cubans | 0.0 /100 | #291 | Tragic 82.0% |
| Paiute | 0.0 /100 | #292 | Tragic 82.0% |
| British West Indians | 0.0 /100 | #293 | Tragic 82.0% |
| Immigrants | St. Vincent and the Grenadines | 0.0 /100 | #294 | Tragic 82.0% |
| Nepalese | 0.0 /100 | #295 | Tragic 81.9% |
| Vietnamese | 0.0 /100 | #296 | Tragic 81.9% |
| Immigrants | Bangladesh | 0.0 /100 | #297 | Tragic 81.9% |
| Ute | 0.0 /100 | #298 | Tragic 81.8% |
| Ecuadorians | 0.0 /100 | #299 | Tragic 81.7% |
| Fijians | 0.0 /100 | #300 | Tragic 81.6% |
| Dutch West Indians | 0.0 /100 | #301 | Tragic 81.6% |
| Immigrants | Haiti | 0.0 /100 | #302 | Tragic 81.6% |
| Immigrants | Portugal | 0.0 /100 | #303 | Tragic 81.6% |
| Navajo | 0.0 /100 | #304 | Tragic 81.5% |
| Immigrants | Grenada | 0.0 /100 | #305 | Tragic 81.3% |
Demographics Similar to Moroccans by GED/Equivalency
In terms of ged/equivalency, the demographic groups most similar to Moroccans are Immigrants from Southern Europe (85.5%, a difference of 0.020%), Aleut (85.6%, a difference of 0.060%), Sudanese (85.5%, a difference of 0.060%), Korean (85.6%, a difference of 0.080%), and Immigrants from Sudan (85.5%, a difference of 0.080%).
| Demographics | Rating | Rank | GED/Equivalency |
| Ottawa | 50.0 /100 | #174 | Average 85.8% |
| Immigrants | Bolivia | 49.8 /100 | #175 | Average 85.8% |
| Immigrants | Eastern Africa | 47.7 /100 | #176 | Average 85.7% |
| Immigrants | Uganda | 45.2 /100 | #177 | Average 85.7% |
| Koreans | 41.2 /100 | #178 | Average 85.6% |
| Aleuts | 40.5 /100 | #179 | Average 85.6% |
| Immigrants | Southern Europe | 38.4 /100 | #180 | Fair 85.5% |
| Moroccans | 37.7 /100 | #181 | Fair 85.5% |
| Sudanese | 35.2 /100 | #182 | Fair 85.5% |
| Immigrants | Sudan | 34.2 /100 | #183 | Fair 85.5% |
| Immigrants | Oceania | 33.6 /100 | #184 | Fair 85.5% |
| Spanish | 32.8 /100 | #185 | Fair 85.4% |
| Spaniards | 31.9 /100 | #186 | Fair 85.4% |
| Immigrants | Afghanistan | 29.8 /100 | #187 | Fair 85.4% |
| Immigrants | Sierra Leone | 29.0 /100 | #188 | Fair 85.4% |