Immigrants from Belgium vs Moroccan In Labor Force | Age 20-64
COMPARE
Immigrants from Belgium
Moroccan
In Labor Force | Age 20-64
In Labor Force | Age 20-64 Comparison
Immigrants from Belgium
Moroccans
79.6%
IN LABOR FORCE | AGE 20-64
53.1/ 100
METRIC RATING
172nd/ 347
METRIC RANK
79.7%
IN LABOR FORCE | AGE 20-64
66.7/ 100
METRIC RATING
160th/ 347
METRIC RANK
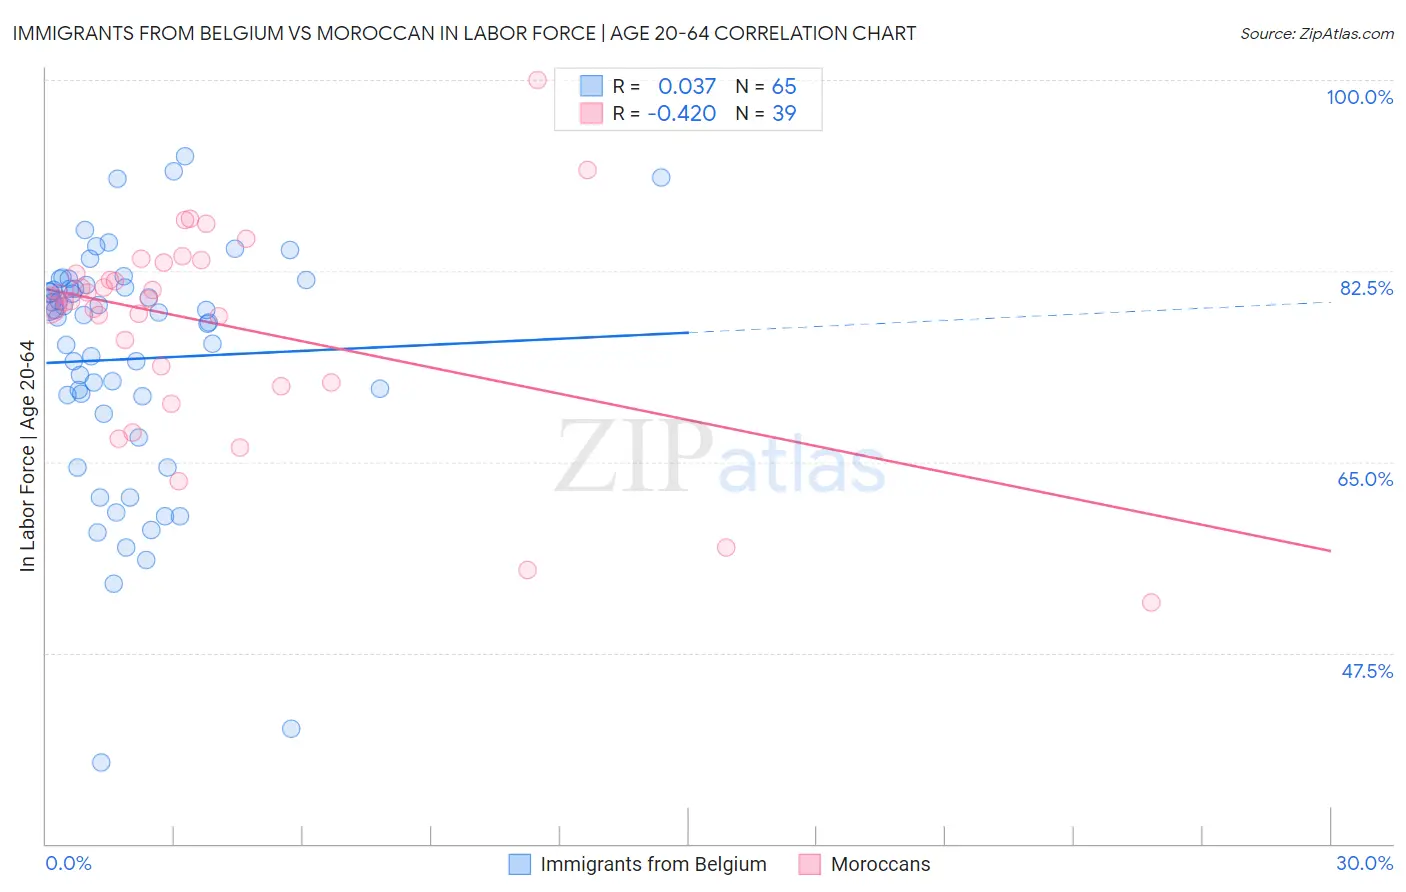
Immigrants from Belgium vs Moroccan In Labor Force | Age 20-64 Correlation Chart
The statistical analysis conducted on geographies consisting of 146,728,908 people shows no correlation between the proportion of Immigrants from Belgium and labor force participation rate among population between the ages 20 and 64 in the United States with a correlation coefficient (R) of 0.037 and weighted average of 79.6%. Similarly, the statistical analysis conducted on geographies consisting of 201,807,372 people shows a moderate negative correlation between the proportion of Moroccans and labor force participation rate among population between the ages 20 and 64 in the United States with a correlation coefficient (R) of -0.420 and weighted average of 79.7%, a difference of 0.11%.
In Labor Force | Age 20-64 Correlation Summary
| Measurement | Immigrants from Belgium | Moroccan |
| Minimum | 37.4% | 52.1% |
| Maximum | 93.0% | 100.0% |
| Range | 55.6% | 47.9% |
| Mean | 74.4% | 77.6% |
| Median | 78.5% | 79.7% |
| Interquartile 25% (IQ1) | 70.2% | 72.3% |
| Interquartile 75% (IQ3) | 81.1% | 83.3% |
| Interquartile Range (IQR) | 10.9% | 11.0% |
| Standard Deviation (Sample) | 11.2% | 9.7% |
| Standard Deviation (Population) | 11.1% | 9.5% |
Demographics Similar to Immigrants from Belgium and Moroccans by In Labor Force | Age 20-64
In terms of in labor force | age 20-64, the demographic groups most similar to Immigrants from Belgium are Immigrants from Switzerland (79.6%, a difference of 0.0%), Slavic (79.6%, a difference of 0.010%), Immigrants from Scotland (79.6%, a difference of 0.010%), Syrian (79.6%, a difference of 0.030%), and Laotian (79.6%, a difference of 0.040%). Similarly, the demographic groups most similar to Moroccans are Immigrants from Cuba (79.7%, a difference of 0.0%), South African (79.7%, a difference of 0.0%), Austrian (79.7%, a difference of 0.010%), German (79.7%, a difference of 0.010%), and Senegalese (79.7%, a difference of 0.020%).
| Demographics | Rating | Rank | In Labor Force | Age 20-64 |
| Senegalese | 69.1 /100 | #156 | Good 79.7% |
| Immigrants | China | 69.1 /100 | #157 | Good 79.7% |
| Austrians | 67.6 /100 | #158 | Good 79.7% |
| Immigrants | Cuba | 66.7 /100 | #159 | Good 79.7% |
| Moroccans | 66.7 /100 | #160 | Good 79.7% |
| South Africans | 66.2 /100 | #161 | Good 79.7% |
| Germans | 65.2 /100 | #162 | Good 79.7% |
| Immigrants | Costa Rica | 64.6 /100 | #163 | Good 79.7% |
| Immigrants | Burma/Myanmar | 64.4 /100 | #164 | Good 79.7% |
| Nigerians | 64.0 /100 | #165 | Good 79.7% |
| Okinawans | 62.7 /100 | #166 | Good 79.6% |
| Immigrants | Iraq | 62.0 /100 | #167 | Good 79.6% |
| Immigrants | Indonesia | 61.8 /100 | #168 | Good 79.6% |
| Laotians | 58.4 /100 | #169 | Average 79.6% |
| Slavs | 54.0 /100 | #170 | Average 79.6% |
| Immigrants | Switzerland | 53.3 /100 | #171 | Average 79.6% |
| Immigrants | Belgium | 53.1 /100 | #172 | Average 79.6% |
| Immigrants | Scotland | 52.4 /100 | #173 | Average 79.6% |
| Syrians | 50.0 /100 | #174 | Average 79.6% |
| Cubans | 46.1 /100 | #175 | Average 79.5% |
| Australians | 46.0 /100 | #176 | Average 79.5% |