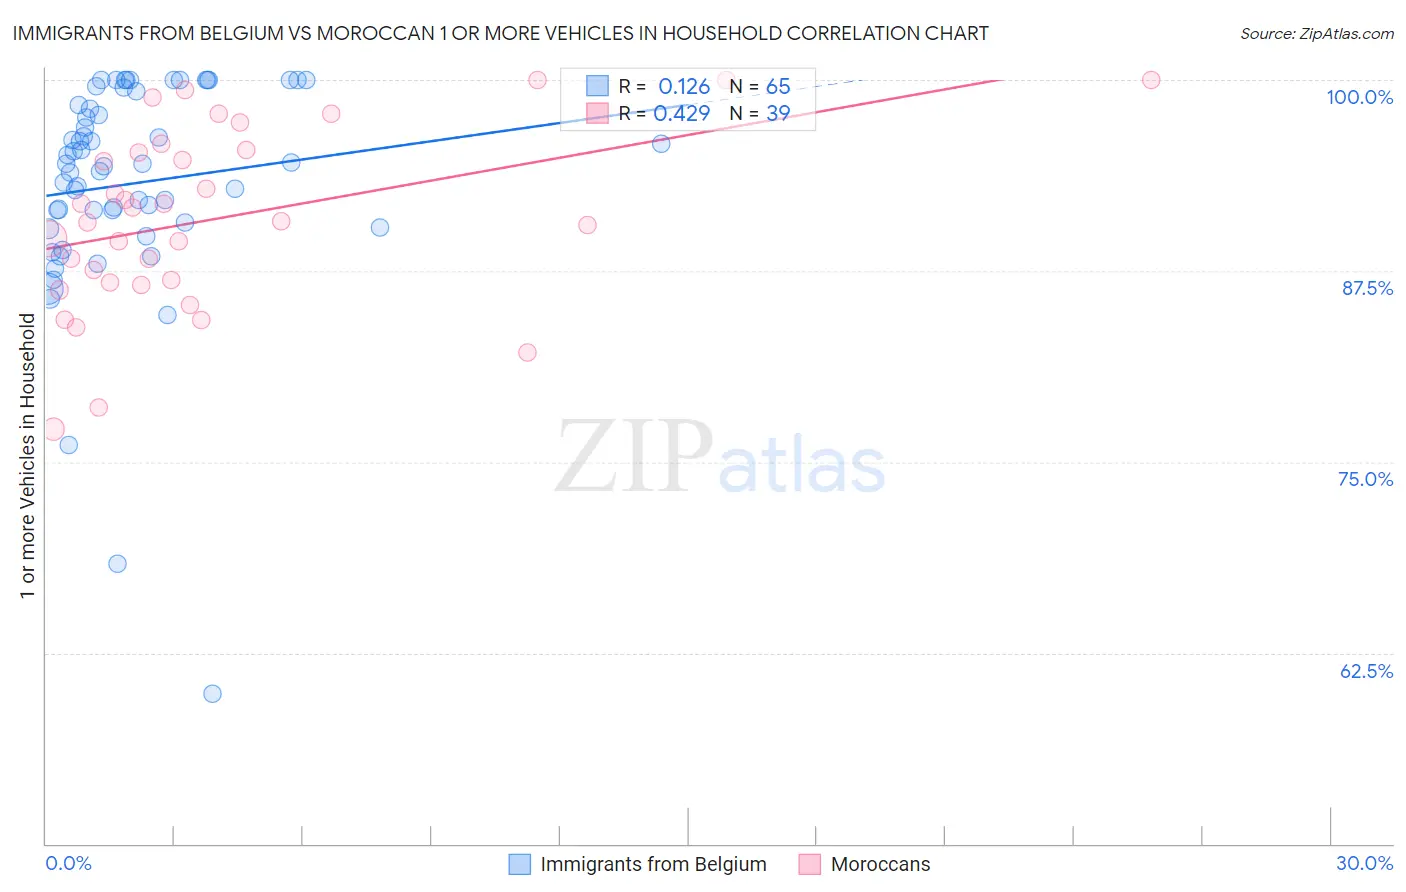
Immigrants from Belgium vs Moroccan 1 or more Vehicles in Household
COMPARE
Immigrants from Belgium
Moroccan
1 or more Vehicles in Household
1 or more Vehicles in Household Comparison
Immigrants from Belgium
Moroccans
88.4%
1 OR MORE VEHICLES IN HOUSEHOLD
2.1/ 100
METRIC RATING
243rd/ 347
METRIC RANK
85.4%
1 OR MORE VEHICLES IN HOUSEHOLD
0.0/ 100
METRIC RATING
302nd/ 347
METRIC RANK
Immigrants from Belgium vs Moroccan 1 or more Vehicles in Household Correlation Chart
The statistical analysis conducted on geographies consisting of 146,691,899 people shows a poor positive correlation between the proportion of Immigrants from Belgium and percentage of households with 1 or more vehicles available in the United States with a correlation coefficient (R) of 0.126 and weighted average of 88.4%. Similarly, the statistical analysis conducted on geographies consisting of 201,766,092 people shows a moderate positive correlation between the proportion of Moroccans and percentage of households with 1 or more vehicles available in the United States with a correlation coefficient (R) of 0.429 and weighted average of 85.4%, a difference of 3.5%.
1 or more Vehicles in Household Correlation Summary
| Measurement | Immigrants from Belgium | Moroccan |
| Minimum | 59.8% | 77.2% |
| Maximum | 100.0% | 100.0% |
| Range | 40.2% | 22.8% |
| Mean | 93.2% | 90.9% |
| Median | 94.5% | 90.8% |
| Interquartile 25% (IQ1) | 90.5% | 86.7% |
| Interquartile 75% (IQ3) | 98.8% | 95.5% |
| Interquartile Range (IQR) | 8.4% | 8.7% |
| Standard Deviation (Sample) | 7.2% | 5.9% |
| Standard Deviation (Population) | 7.2% | 5.8% |
Similar Demographics by 1 or more Vehicles in Household
Demographics Similar to Immigrants from Belgium by 1 or more Vehicles in Household
In terms of 1 or more vehicles in household, the demographic groups most similar to Immigrants from Belgium are Immigrants from Portugal (88.3%, a difference of 0.020%), Immigrants from Czechoslovakia (88.3%, a difference of 0.040%), Menominee (88.3%, a difference of 0.050%), Turkish (88.4%, a difference of 0.060%), and Immigrants from Honduras (88.3%, a difference of 0.080%).
| Demographics | Rating | Rank | 1 or more Vehicles in Household |
| Immigrants | Pakistan | 4.5 /100 | #236 | Tragic 88.6% |
| Immigrants | Turkey | 4.4 /100 | #237 | Tragic 88.6% |
| Immigrants | Somalia | 4.2 /100 | #238 | Tragic 88.6% |
| Kiowa | 3.8 /100 | #239 | Tragic 88.6% |
| Eastern Europeans | 3.0 /100 | #240 | Tragic 88.5% |
| Taiwanese | 2.6 /100 | #241 | Tragic 88.4% |
| Turks | 2.5 /100 | #242 | Tragic 88.4% |
| Immigrants | Belgium | 2.1 /100 | #243 | Tragic 88.4% |
| Immigrants | Portugal | 2.0 /100 | #244 | Tragic 88.3% |
| Immigrants | Czechoslovakia | 1.9 /100 | #245 | Tragic 88.3% |
| Menominee | 1.9 /100 | #246 | Tragic 88.3% |
| Immigrants | Honduras | 1.7 /100 | #247 | Tragic 88.3% |
| Immigrants | Nigeria | 1.5 /100 | #248 | Tragic 88.2% |
| Blacks/African Americans | 1.4 /100 | #249 | Tragic 88.2% |
| Egyptians | 1.2 /100 | #250 | Tragic 88.2% |
Demographics Similar to Moroccans by 1 or more Vehicles in Household
In terms of 1 or more vehicles in household, the demographic groups most similar to Moroccans are Immigrants from Panama (85.4%, a difference of 0.020%), Immigrants from Greece (85.4%, a difference of 0.030%), Immigrants from Russia (85.4%, a difference of 0.060%), Yuman (85.5%, a difference of 0.070%), and Immigrants from Ukraine (85.2%, a difference of 0.20%).
| Demographics | Rating | Rank | 1 or more Vehicles in Household |
| Immigrants | Jamaica | 0.0 /100 | #295 | Tragic 85.8% |
| Immigrants | Spain | 0.0 /100 | #296 | Tragic 85.8% |
| Paraguayans | 0.0 /100 | #297 | Tragic 85.7% |
| Belizeans | 0.0 /100 | #298 | Tragic 85.7% |
| Yuman | 0.0 /100 | #299 | Tragic 85.5% |
| Immigrants | Russia | 0.0 /100 | #300 | Tragic 85.4% |
| Immigrants | Panama | 0.0 /100 | #301 | Tragic 85.4% |
| Moroccans | 0.0 /100 | #302 | Tragic 85.4% |
| Immigrants | Greece | 0.0 /100 | #303 | Tragic 85.4% |
| Immigrants | Ukraine | 0.0 /100 | #304 | Tragic 85.2% |
| Immigrants | China | 0.0 /100 | #305 | Tragic 84.9% |
| Immigrants | Western Africa | 0.0 /100 | #306 | Tragic 84.9% |
| Tohono O'odham | 0.0 /100 | #307 | Tragic 84.7% |
| Immigrants | Belize | 0.0 /100 | #308 | Tragic 84.7% |
| Immigrants | Haiti | 0.0 /100 | #309 | Tragic 84.7% |