West Indian vs Immigrants from Moldova GED/Equivalency
COMPARE
West Indian
Immigrants from Moldova
GED/Equivalency
GED/Equivalency Comparison
West Indians
Immigrants from Moldova
83.1%
GED/EQUIVALENCY
0.2/ 100
METRIC RATING
265th/ 347
METRIC RANK
87.7%
GED/EQUIVALENCY
98.8/ 100
METRIC RATING
72nd/ 347
METRIC RANK
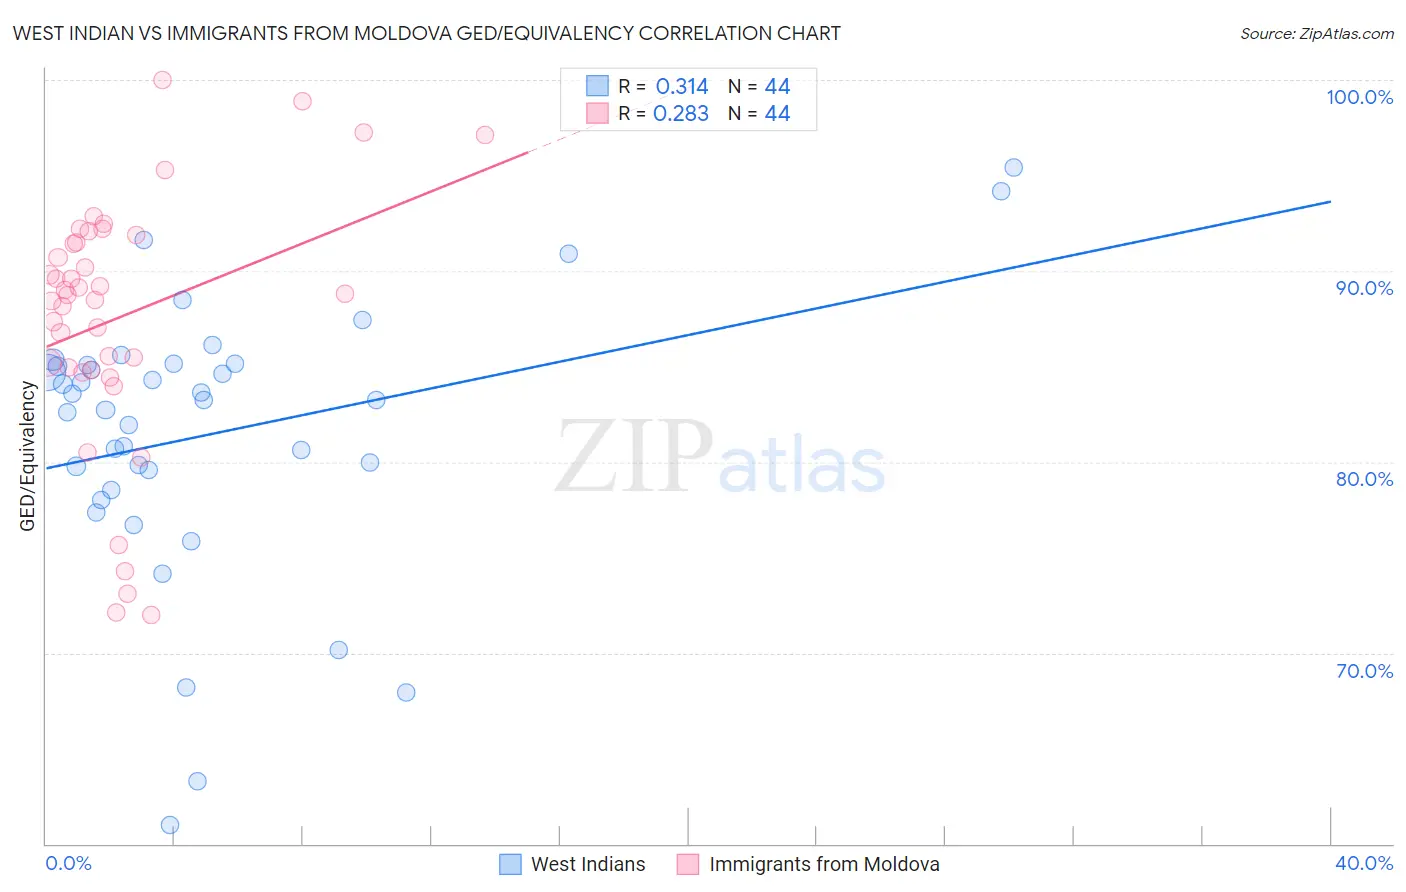
West Indian vs Immigrants from Moldova GED/Equivalency Correlation Chart
The statistical analysis conducted on geographies consisting of 254,063,654 people shows a mild positive correlation between the proportion of West Indians and percentage of population with at least ged/equivalency education in the United States with a correlation coefficient (R) of 0.314 and weighted average of 83.1%. Similarly, the statistical analysis conducted on geographies consisting of 124,401,069 people shows a weak positive correlation between the proportion of Immigrants from Moldova and percentage of population with at least ged/equivalency education in the United States with a correlation coefficient (R) of 0.283 and weighted average of 87.7%, a difference of 5.6%.
GED/Equivalency Correlation Summary
| Measurement | West Indian | Immigrants from Moldova |
| Minimum | 61.0% | 72.0% |
| Maximum | 95.4% | 100.0% |
| Range | 34.5% | 28.0% |
| Mean | 81.5% | 87.6% |
| Median | 83.3% | 88.8% |
| Interquartile 25% (IQ1) | 79.0% | 84.9% |
| Interquartile 75% (IQ3) | 85.1% | 91.7% |
| Interquartile Range (IQR) | 6.1% | 6.8% |
| Standard Deviation (Sample) | 7.2% | 6.7% |
| Standard Deviation (Population) | 7.1% | 6.6% |
Similar Demographics by GED/Equivalency
Demographics Similar to West Indians by GED/Equivalency
In terms of ged/equivalency, the demographic groups most similar to West Indians are Bangladeshi (83.1%, a difference of 0.010%), Kiowa (83.1%, a difference of 0.010%), Immigrants from Congo (83.1%, a difference of 0.020%), Trinidadian and Tobagonian (83.0%, a difference of 0.020%), and Inupiat (83.1%, a difference of 0.030%).
| Demographics | Rating | Rank | GED/Equivalency |
| Malaysians | 0.4 /100 | #258 | Tragic 83.3% |
| Immigrants | Vietnam | 0.3 /100 | #259 | Tragic 83.2% |
| Choctaw | 0.3 /100 | #260 | Tragic 83.1% |
| Inupiat | 0.2 /100 | #261 | Tragic 83.1% |
| Immigrants | Armenia | 0.2 /100 | #262 | Tragic 83.1% |
| Immigrants | Congo | 0.2 /100 | #263 | Tragic 83.1% |
| Bangladeshis | 0.2 /100 | #264 | Tragic 83.1% |
| West Indians | 0.2 /100 | #265 | Tragic 83.1% |
| Kiowa | 0.2 /100 | #266 | Tragic 83.1% |
| Trinidadians and Tobagonians | 0.2 /100 | #267 | Tragic 83.0% |
| Immigrants | Burma/Myanmar | 0.2 /100 | #268 | Tragic 83.0% |
| Hopi | 0.2 /100 | #269 | Tragic 83.0% |
| Immigrants | Jamaica | 0.2 /100 | #270 | Tragic 82.9% |
| U.S. Virgin Islanders | 0.2 /100 | #271 | Tragic 82.9% |
| Barbadians | 0.1 /100 | #272 | Tragic 82.9% |
Demographics Similar to Immigrants from Moldova by GED/Equivalency
In terms of ged/equivalency, the demographic groups most similar to Immigrants from Moldova are Ukrainian (87.7%, a difference of 0.0%), Austrian (87.7%, a difference of 0.0%), Belgian (87.7%, a difference of 0.010%), Immigrants from Kuwait (87.7%, a difference of 0.030%), and Immigrants from Saudi Arabia (87.8%, a difference of 0.050%).
| Demographics | Rating | Rank | GED/Equivalency |
| Immigrants | North America | 99.1 /100 | #65 | Exceptional 87.8% |
| Immigrants | Bulgaria | 99.1 /100 | #66 | Exceptional 87.8% |
| British | 99.1 /100 | #67 | Exceptional 87.8% |
| Immigrants | France | 99.1 /100 | #68 | Exceptional 87.8% |
| Immigrants | Saudi Arabia | 99.0 /100 | #69 | Exceptional 87.8% |
| Ukrainians | 98.8 /100 | #70 | Exceptional 87.7% |
| Austrians | 98.8 /100 | #71 | Exceptional 87.7% |
| Immigrants | Moldova | 98.8 /100 | #72 | Exceptional 87.7% |
| Belgians | 98.8 /100 | #73 | Exceptional 87.7% |
| Immigrants | Kuwait | 98.8 /100 | #74 | Exceptional 87.7% |
| Scottish | 98.7 /100 | #75 | Exceptional 87.7% |
| Immigrants | Serbia | 98.7 /100 | #76 | Exceptional 87.7% |
| Slavs | 98.7 /100 | #77 | Exceptional 87.7% |
| Irish | 98.6 /100 | #78 | Exceptional 87.6% |
| English | 98.6 /100 | #79 | Exceptional 87.6% |