Immigrants from Bahamas vs Native Hawaiian College, Under 1 year
COMPARE
Immigrants from Bahamas
Native Hawaiian
College, Under 1 year
College, Under 1 year Comparison
Immigrants from Bahamas
Native Hawaiians
61.1%
COLLEGE, UNDER 1 YEAR
0.2/ 100
METRIC RATING
265th/ 347
METRIC RANK
63.9%
COLLEGE, UNDER 1 YEAR
10.6/ 100
METRIC RATING
211th/ 347
METRIC RANK
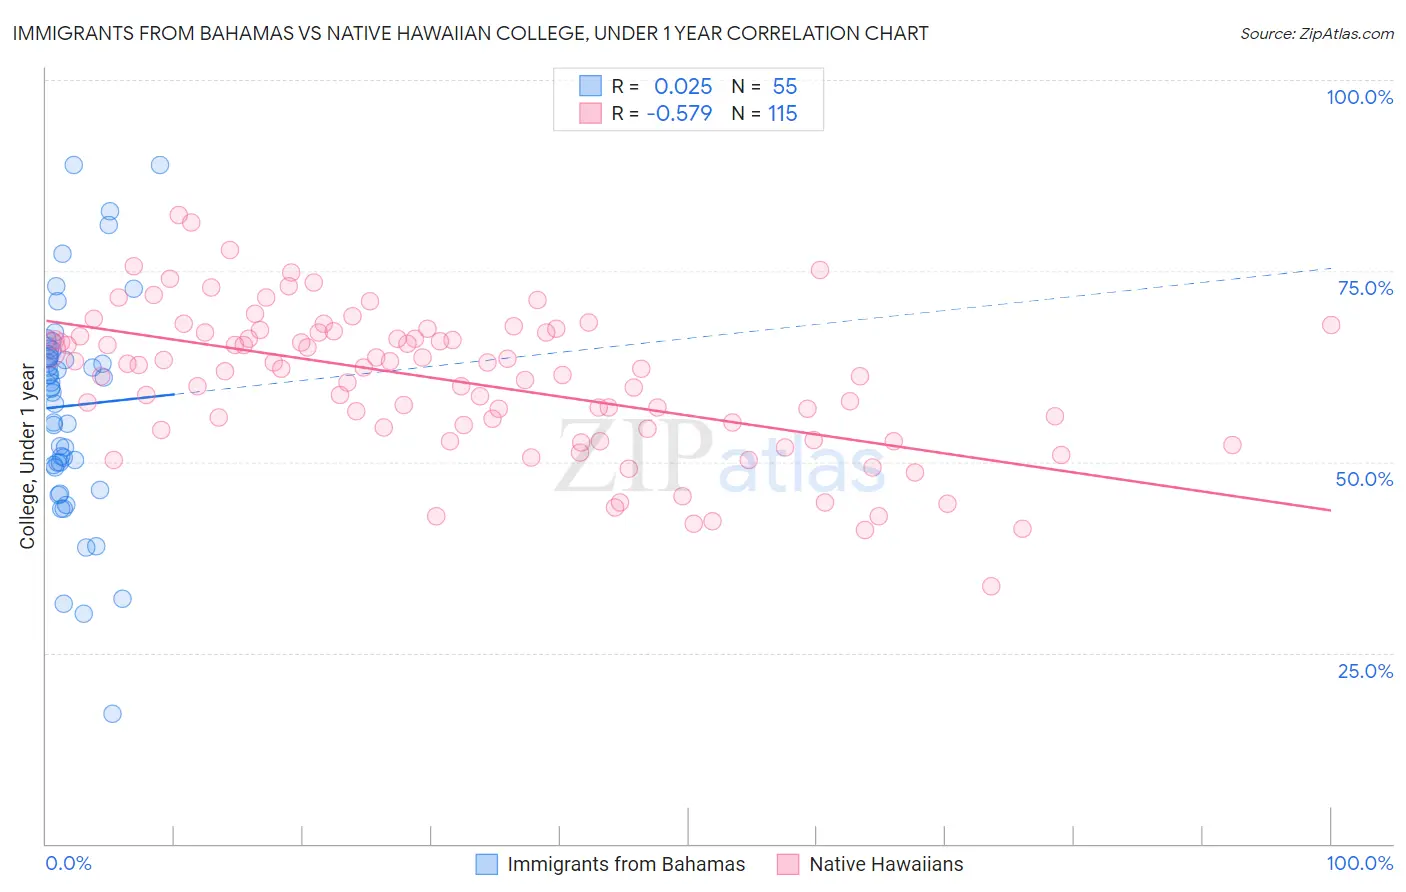
Immigrants from Bahamas vs Native Hawaiian College, Under 1 year Correlation Chart
The statistical analysis conducted on geographies consisting of 104,668,341 people shows no correlation between the proportion of Immigrants from Bahamas and percentage of population with at least college, under 1 year education in the United States with a correlation coefficient (R) of 0.025 and weighted average of 61.1%. Similarly, the statistical analysis conducted on geographies consisting of 332,118,930 people shows a substantial negative correlation between the proportion of Native Hawaiians and percentage of population with at least college, under 1 year education in the United States with a correlation coefficient (R) of -0.579 and weighted average of 63.9%, a difference of 4.6%.
College, Under 1 year Correlation Summary
| Measurement | Immigrants from Bahamas | Native Hawaiian |
| Minimum | 17.1% | 33.7% |
| Maximum | 88.9% | 82.3% |
| Range | 71.8% | 48.7% |
| Mean | 57.3% | 60.5% |
| Median | 59.8% | 62.2% |
| Interquartile 25% (IQ1) | 49.6% | 54.4% |
| Interquartile 75% (IQ3) | 64.6% | 67.0% |
| Interquartile Range (IQR) | 15.0% | 12.6% |
| Standard Deviation (Sample) | 14.1% | 9.4% |
| Standard Deviation (Population) | 14.0% | 9.4% |
Similar Demographics by College, Under 1 year
Demographics Similar to Immigrants from Bahamas by College, Under 1 year
In terms of college, under 1 year, the demographic groups most similar to Immigrants from Bahamas are Trinidadian and Tobagonian (61.1%, a difference of 0.0%), Shoshone (61.1%, a difference of 0.060%), Barbadian (61.1%, a difference of 0.070%), African (61.1%, a difference of 0.11%), and Alaskan Athabascan (61.0%, a difference of 0.12%).
| Demographics | Rating | Rank | College, Under 1 year |
| Immigrants | Bangladesh | 0.3 /100 | #258 | Tragic 61.3% |
| Indonesians | 0.3 /100 | #259 | Tragic 61.2% |
| Blackfeet | 0.3 /100 | #260 | Tragic 61.1% |
| Africans | 0.3 /100 | #261 | Tragic 61.1% |
| Barbadians | 0.2 /100 | #262 | Tragic 61.1% |
| Shoshone | 0.2 /100 | #263 | Tragic 61.1% |
| Trinidadians and Tobagonians | 0.2 /100 | #264 | Tragic 61.1% |
| Immigrants | Bahamas | 0.2 /100 | #265 | Tragic 61.1% |
| Alaskan Athabascans | 0.2 /100 | #266 | Tragic 61.0% |
| Americans | 0.2 /100 | #267 | Tragic 61.0% |
| Immigrants | Trinidad and Tobago | 0.1 /100 | #268 | Tragic 60.7% |
| Immigrants | West Indies | 0.1 /100 | #269 | Tragic 60.6% |
| Cheyenne | 0.1 /100 | #270 | Tragic 60.6% |
| U.S. Virgin Islanders | 0.1 /100 | #271 | Tragic 60.6% |
| Jamaicans | 0.1 /100 | #272 | Tragic 60.5% |
Demographics Similar to Native Hawaiians by College, Under 1 year
In terms of college, under 1 year, the demographic groups most similar to Native Hawaiians are Immigrants from Middle Africa (63.9%, a difference of 0.010%), Ghanaian (63.9%, a difference of 0.070%), Puget Sound Salish (63.9%, a difference of 0.080%), Immigrants from Vietnam (64.0%, a difference of 0.17%), and Immigrants from South America (63.8%, a difference of 0.19%).
| Demographics | Rating | Rank | College, Under 1 year |
| Immigrants | Zaire | 14.6 /100 | #204 | Poor 64.1% |
| Peruvians | 13.7 /100 | #205 | Poor 64.1% |
| Whites/Caucasians | 12.8 /100 | #206 | Poor 64.0% |
| Colombians | 12.4 /100 | #207 | Poor 64.0% |
| Immigrants | Vietnam | 12.1 /100 | #208 | Poor 64.0% |
| Puget Sound Salish | 11.3 /100 | #209 | Poor 63.9% |
| Ghanaians | 11.2 /100 | #210 | Poor 63.9% |
| Native Hawaiians | 10.6 /100 | #211 | Poor 63.9% |
| Immigrants | Middle Africa | 10.5 /100 | #212 | Poor 63.9% |
| Immigrants | South America | 9.1 /100 | #213 | Tragic 63.8% |
| Immigrants | Nigeria | 8.8 /100 | #214 | Tragic 63.7% |
| Senegalese | 7.7 /100 | #215 | Tragic 63.6% |
| Hmong | 6.8 /100 | #216 | Tragic 63.5% |
| Immigrants | Uruguay | 5.8 /100 | #217 | Tragic 63.4% |
| Immigrants | Panama | 5.7 /100 | #218 | Tragic 63.4% |