Immigrants from Bahamas vs Dominican College, Under 1 year
COMPARE
Immigrants from Bahamas
Dominican
College, Under 1 year
College, Under 1 year Comparison
Immigrants from Bahamas
Dominicans
61.1%
COLLEGE, UNDER 1 YEAR
0.2/ 100
METRIC RATING
265th/ 347
METRIC RANK
55.5%
COLLEGE, UNDER 1 YEAR
0.0/ 100
METRIC RATING
331st/ 347
METRIC RANK
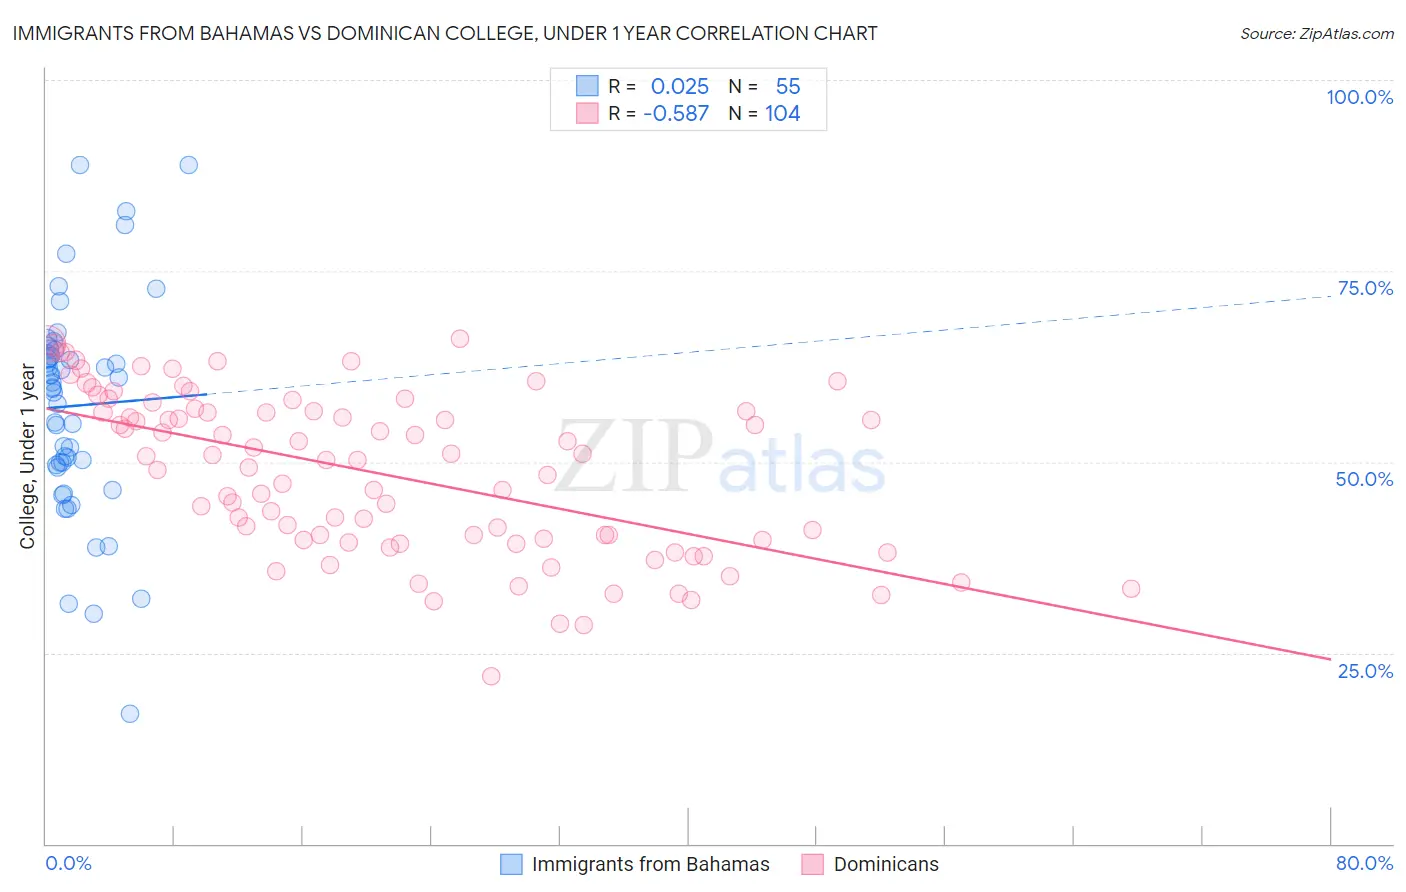
Immigrants from Bahamas vs Dominican College, Under 1 year Correlation Chart
The statistical analysis conducted on geographies consisting of 104,668,341 people shows no correlation between the proportion of Immigrants from Bahamas and percentage of population with at least college, under 1 year education in the United States with a correlation coefficient (R) of 0.025 and weighted average of 61.1%. Similarly, the statistical analysis conducted on geographies consisting of 355,140,552 people shows a substantial negative correlation between the proportion of Dominicans and percentage of population with at least college, under 1 year education in the United States with a correlation coefficient (R) of -0.587 and weighted average of 55.5%, a difference of 10.1%.
College, Under 1 year Correlation Summary
| Measurement | Immigrants from Bahamas | Dominican |
| Minimum | 17.1% | 22.0% |
| Maximum | 88.9% | 66.2% |
| Range | 71.8% | 44.2% |
| Mean | 57.3% | 48.5% |
| Median | 59.8% | 50.2% |
| Interquartile 25% (IQ1) | 49.6% | 39.7% |
| Interquartile 75% (IQ3) | 64.6% | 56.6% |
| Interquartile Range (IQR) | 15.0% | 16.9% |
| Standard Deviation (Sample) | 14.1% | 10.5% |
| Standard Deviation (Population) | 14.0% | 10.4% |
Similar Demographics by College, Under 1 year
Demographics Similar to Immigrants from Bahamas by College, Under 1 year
In terms of college, under 1 year, the demographic groups most similar to Immigrants from Bahamas are Trinidadian and Tobagonian (61.1%, a difference of 0.0%), Shoshone (61.1%, a difference of 0.060%), Barbadian (61.1%, a difference of 0.070%), African (61.1%, a difference of 0.11%), and Alaskan Athabascan (61.0%, a difference of 0.12%).
| Demographics | Rating | Rank | College, Under 1 year |
| Immigrants | Bangladesh | 0.3 /100 | #258 | Tragic 61.3% |
| Indonesians | 0.3 /100 | #259 | Tragic 61.2% |
| Blackfeet | 0.3 /100 | #260 | Tragic 61.1% |
| Africans | 0.3 /100 | #261 | Tragic 61.1% |
| Barbadians | 0.2 /100 | #262 | Tragic 61.1% |
| Shoshone | 0.2 /100 | #263 | Tragic 61.1% |
| Trinidadians and Tobagonians | 0.2 /100 | #264 | Tragic 61.1% |
| Immigrants | Bahamas | 0.2 /100 | #265 | Tragic 61.1% |
| Alaskan Athabascans | 0.2 /100 | #266 | Tragic 61.0% |
| Americans | 0.2 /100 | #267 | Tragic 61.0% |
| Immigrants | Trinidad and Tobago | 0.1 /100 | #268 | Tragic 60.7% |
| Immigrants | West Indies | 0.1 /100 | #269 | Tragic 60.6% |
| Cheyenne | 0.1 /100 | #270 | Tragic 60.6% |
| U.S. Virgin Islanders | 0.1 /100 | #271 | Tragic 60.6% |
| Jamaicans | 0.1 /100 | #272 | Tragic 60.5% |
Demographics Similar to Dominicans by College, Under 1 year
In terms of college, under 1 year, the demographic groups most similar to Dominicans are Mexican (55.6%, a difference of 0.26%), Immigrants from Cuba (55.7%, a difference of 0.40%), Immigrants from Yemen (55.3%, a difference of 0.41%), Yuman (55.1%, a difference of 0.73%), and Cape Verdean (56.0%, a difference of 1.0%).
| Demographics | Rating | Rank | College, Under 1 year |
| Immigrants | El Salvador | 0.0 /100 | #324 | Tragic 56.4% |
| Immigrants | Latin America | 0.0 /100 | #325 | Tragic 56.3% |
| Navajo | 0.0 /100 | #326 | Tragic 56.3% |
| Immigrants | Guatemala | 0.0 /100 | #327 | Tragic 56.2% |
| Cape Verdeans | 0.0 /100 | #328 | Tragic 56.0% |
| Immigrants | Cuba | 0.0 /100 | #329 | Tragic 55.7% |
| Mexicans | 0.0 /100 | #330 | Tragic 55.6% |
| Dominicans | 0.0 /100 | #331 | Tragic 55.5% |
| Immigrants | Yemen | 0.0 /100 | #332 | Tragic 55.3% |
| Yuman | 0.0 /100 | #333 | Tragic 55.1% |
| Immigrants | Azores | 0.0 /100 | #334 | Tragic 54.7% |
| Inupiat | 0.0 /100 | #335 | Tragic 54.6% |
| Pennsylvania Germans | 0.0 /100 | #336 | Tragic 54.5% |
| Immigrants | Central America | 0.0 /100 | #337 | Tragic 54.4% |
| Lumbee | 0.0 /100 | #338 | Tragic 54.2% |