Immigrants from Bahamas vs Immigrants from Japan College, Under 1 year
COMPARE
Immigrants from Bahamas
Immigrants from Japan
College, Under 1 year
College, Under 1 year Comparison
Immigrants from Bahamas
Immigrants from Japan
61.1%
COLLEGE, UNDER 1 YEAR
0.2/ 100
METRIC RATING
265th/ 347
METRIC RANK
71.9%
COLLEGE, UNDER 1 YEAR
100.0/ 100
METRIC RATING
16th/ 347
METRIC RANK
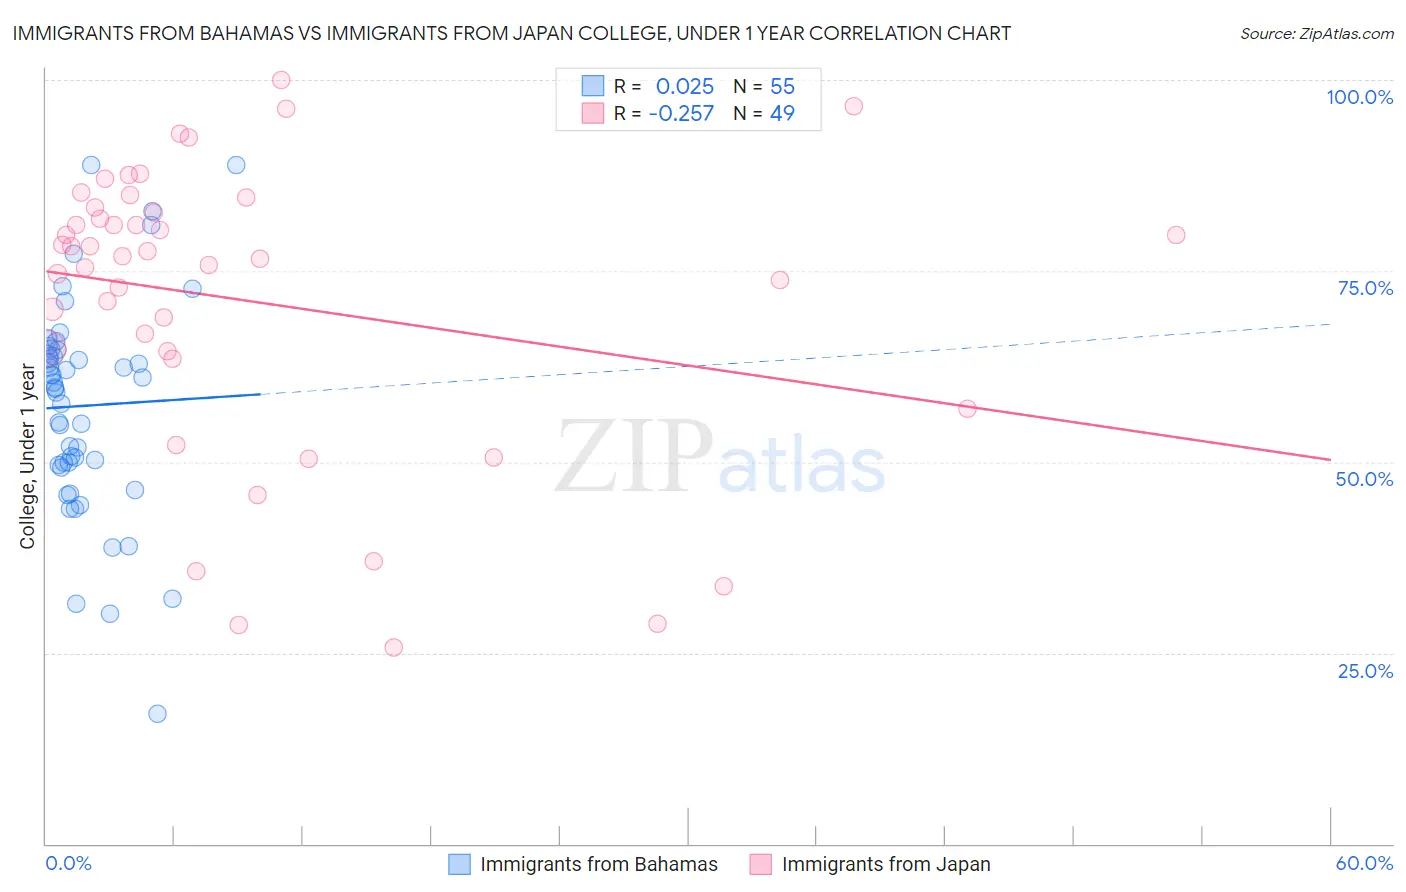
Immigrants from Bahamas vs Immigrants from Japan College, Under 1 year Correlation Chart
The statistical analysis conducted on geographies consisting of 104,668,341 people shows no correlation between the proportion of Immigrants from Bahamas and percentage of population with at least college, under 1 year education in the United States with a correlation coefficient (R) of 0.025 and weighted average of 61.1%. Similarly, the statistical analysis conducted on geographies consisting of 340,148,871 people shows a weak negative correlation between the proportion of Immigrants from Japan and percentage of population with at least college, under 1 year education in the United States with a correlation coefficient (R) of -0.257 and weighted average of 71.9%, a difference of 17.7%.
College, Under 1 year Correlation Summary
| Measurement | Immigrants from Bahamas | Immigrants from Japan |
| Minimum | 17.1% | 25.7% |
| Maximum | 88.9% | 100.0% |
| Range | 71.8% | 74.3% |
| Mean | 57.3% | 71.0% |
| Median | 59.8% | 76.9% |
| Interquartile 25% (IQ1) | 49.6% | 64.0% |
| Interquartile 75% (IQ3) | 64.6% | 82.9% |
| Interquartile Range (IQR) | 15.0% | 19.0% |
| Standard Deviation (Sample) | 14.1% | 19.0% |
| Standard Deviation (Population) | 14.0% | 18.8% |
Similar Demographics by College, Under 1 year
Demographics Similar to Immigrants from Bahamas by College, Under 1 year
In terms of college, under 1 year, the demographic groups most similar to Immigrants from Bahamas are Trinidadian and Tobagonian (61.1%, a difference of 0.0%), Shoshone (61.1%, a difference of 0.060%), Barbadian (61.1%, a difference of 0.070%), African (61.1%, a difference of 0.11%), and Alaskan Athabascan (61.0%, a difference of 0.12%).
| Demographics | Rating | Rank | College, Under 1 year |
| Immigrants | Bangladesh | 0.3 /100 | #258 | Tragic 61.3% |
| Indonesians | 0.3 /100 | #259 | Tragic 61.2% |
| Blackfeet | 0.3 /100 | #260 | Tragic 61.1% |
| Africans | 0.3 /100 | #261 | Tragic 61.1% |
| Barbadians | 0.2 /100 | #262 | Tragic 61.1% |
| Shoshone | 0.2 /100 | #263 | Tragic 61.1% |
| Trinidadians and Tobagonians | 0.2 /100 | #264 | Tragic 61.1% |
| Immigrants | Bahamas | 0.2 /100 | #265 | Tragic 61.1% |
| Alaskan Athabascans | 0.2 /100 | #266 | Tragic 61.0% |
| Americans | 0.2 /100 | #267 | Tragic 61.0% |
| Immigrants | Trinidad and Tobago | 0.1 /100 | #268 | Tragic 60.7% |
| Immigrants | West Indies | 0.1 /100 | #269 | Tragic 60.6% |
| Cheyenne | 0.1 /100 | #270 | Tragic 60.6% |
| U.S. Virgin Islanders | 0.1 /100 | #271 | Tragic 60.6% |
| Jamaicans | 0.1 /100 | #272 | Tragic 60.5% |
Demographics Similar to Immigrants from Japan by College, Under 1 year
In terms of college, under 1 year, the demographic groups most similar to Immigrants from Japan are Cambodian (71.9%, a difference of 0.010%), Burmese (71.9%, a difference of 0.010%), Cypriot (72.0%, a difference of 0.13%), Eastern European (71.8%, a difference of 0.14%), and Immigrants from Switzerland (71.7%, a difference of 0.28%).
| Demographics | Rating | Rank | College, Under 1 year |
| Immigrants | Australia | 100.0 /100 | #9 | Exceptional 72.7% |
| Immigrants | Israel | 100.0 /100 | #10 | Exceptional 72.3% |
| Immigrants | South Central Asia | 100.0 /100 | #11 | Exceptional 72.1% |
| Immigrants | Sweden | 100.0 /100 | #12 | Exceptional 72.1% |
| Cypriots | 100.0 /100 | #13 | Exceptional 72.0% |
| Cambodians | 100.0 /100 | #14 | Exceptional 71.9% |
| Burmese | 100.0 /100 | #15 | Exceptional 71.9% |
| Immigrants | Japan | 100.0 /100 | #16 | Exceptional 71.9% |
| Eastern Europeans | 100.0 /100 | #17 | Exceptional 71.8% |
| Immigrants | Switzerland | 100.0 /100 | #18 | Exceptional 71.7% |
| Latvians | 100.0 /100 | #19 | Exceptional 71.6% |
| Immigrants | Korea | 100.0 /100 | #20 | Exceptional 71.6% |
| Immigrants | Belgium | 100.0 /100 | #21 | Exceptional 71.5% |
| Immigrants | Eastern Asia | 100.0 /100 | #22 | Exceptional 71.3% |
| Immigrants | Northern Europe | 100.0 /100 | #23 | Exceptional 71.1% |