Immigrants from Bahamas vs Bulgarian College, Under 1 year
COMPARE
Immigrants from Bahamas
Bulgarian
College, Under 1 year
College, Under 1 year Comparison
Immigrants from Bahamas
Bulgarians
61.1%
COLLEGE, UNDER 1 YEAR
0.2/ 100
METRIC RATING
265th/ 347
METRIC RANK
71.1%
COLLEGE, UNDER 1 YEAR
100.0/ 100
METRIC RATING
25th/ 347
METRIC RANK
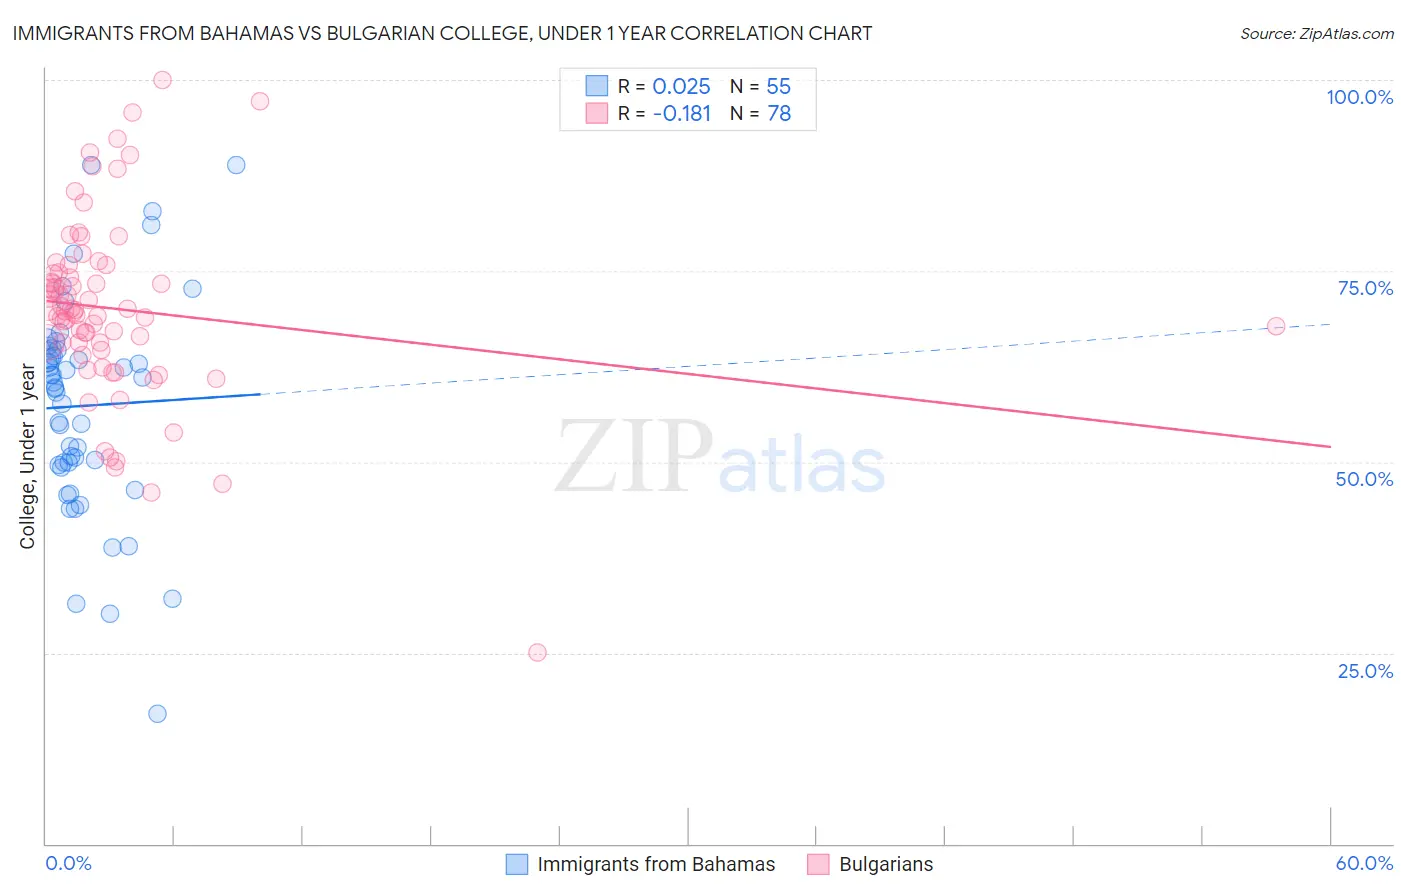
Immigrants from Bahamas vs Bulgarian College, Under 1 year Correlation Chart
The statistical analysis conducted on geographies consisting of 104,668,341 people shows no correlation between the proportion of Immigrants from Bahamas and percentage of population with at least college, under 1 year education in the United States with a correlation coefficient (R) of 0.025 and weighted average of 61.1%. Similarly, the statistical analysis conducted on geographies consisting of 205,631,725 people shows a poor negative correlation between the proportion of Bulgarians and percentage of population with at least college, under 1 year education in the United States with a correlation coefficient (R) of -0.181 and weighted average of 71.1%, a difference of 16.4%.
College, Under 1 year Correlation Summary
| Measurement | Immigrants from Bahamas | Bulgarian |
| Minimum | 17.1% | 25.0% |
| Maximum | 88.9% | 100.0% |
| Range | 71.8% | 75.0% |
| Mean | 57.3% | 70.0% |
| Median | 59.8% | 69.8% |
| Interquartile 25% (IQ1) | 49.6% | 65.6% |
| Interquartile 75% (IQ3) | 64.6% | 74.8% |
| Interquartile Range (IQR) | 15.0% | 9.3% |
| Standard Deviation (Sample) | 14.1% | 12.2% |
| Standard Deviation (Population) | 14.0% | 12.1% |
Similar Demographics by College, Under 1 year
Demographics Similar to Immigrants from Bahamas by College, Under 1 year
In terms of college, under 1 year, the demographic groups most similar to Immigrants from Bahamas are Trinidadian and Tobagonian (61.1%, a difference of 0.0%), Shoshone (61.1%, a difference of 0.060%), Barbadian (61.1%, a difference of 0.070%), African (61.1%, a difference of 0.11%), and Alaskan Athabascan (61.0%, a difference of 0.12%).
| Demographics | Rating | Rank | College, Under 1 year |
| Immigrants | Bangladesh | 0.3 /100 | #258 | Tragic 61.3% |
| Indonesians | 0.3 /100 | #259 | Tragic 61.2% |
| Blackfeet | 0.3 /100 | #260 | Tragic 61.1% |
| Africans | 0.3 /100 | #261 | Tragic 61.1% |
| Barbadians | 0.2 /100 | #262 | Tragic 61.1% |
| Shoshone | 0.2 /100 | #263 | Tragic 61.1% |
| Trinidadians and Tobagonians | 0.2 /100 | #264 | Tragic 61.1% |
| Immigrants | Bahamas | 0.2 /100 | #265 | Tragic 61.1% |
| Alaskan Athabascans | 0.2 /100 | #266 | Tragic 61.0% |
| Americans | 0.2 /100 | #267 | Tragic 61.0% |
| Immigrants | Trinidad and Tobago | 0.1 /100 | #268 | Tragic 60.7% |
| Immigrants | West Indies | 0.1 /100 | #269 | Tragic 60.6% |
| Cheyenne | 0.1 /100 | #270 | Tragic 60.6% |
| U.S. Virgin Islanders | 0.1 /100 | #271 | Tragic 60.6% |
| Jamaicans | 0.1 /100 | #272 | Tragic 60.5% |
Demographics Similar to Bulgarians by College, Under 1 year
In terms of college, under 1 year, the demographic groups most similar to Bulgarians are Soviet Union (71.1%, a difference of 0.020%), Immigrants from Northern Europe (71.1%, a difference of 0.030%), Immigrants from Denmark (71.0%, a difference of 0.12%), Immigrants from Ireland (71.0%, a difference of 0.13%), and Immigrants from Hong Kong (71.0%, a difference of 0.15%).
| Demographics | Rating | Rank | College, Under 1 year |
| Immigrants | Switzerland | 100.0 /100 | #18 | Exceptional 71.7% |
| Latvians | 100.0 /100 | #19 | Exceptional 71.6% |
| Immigrants | Korea | 100.0 /100 | #20 | Exceptional 71.6% |
| Immigrants | Belgium | 100.0 /100 | #21 | Exceptional 71.5% |
| Immigrants | Eastern Asia | 100.0 /100 | #22 | Exceptional 71.3% |
| Immigrants | Northern Europe | 100.0 /100 | #23 | Exceptional 71.1% |
| Soviet Union | 100.0 /100 | #24 | Exceptional 71.1% |
| Bulgarians | 100.0 /100 | #25 | Exceptional 71.1% |
| Immigrants | Denmark | 100.0 /100 | #26 | Exceptional 71.0% |
| Immigrants | Ireland | 100.0 /100 | #27 | Exceptional 71.0% |
| Immigrants | Hong Kong | 100.0 /100 | #28 | Exceptional 71.0% |
| Immigrants | France | 100.0 /100 | #29 | Exceptional 71.0% |
| Immigrants | China | 99.9 /100 | #30 | Exceptional 70.9% |
| Indians (Asian) | 99.9 /100 | #31 | Exceptional 70.8% |
| Turks | 99.9 /100 | #32 | Exceptional 70.7% |