Immigrants from Bahamas vs Seminole College, Under 1 year
COMPARE
Immigrants from Bahamas
Seminole
College, Under 1 year
College, Under 1 year Comparison
Immigrants from Bahamas
Seminole
61.1%
COLLEGE, UNDER 1 YEAR
0.2/ 100
METRIC RATING
265th/ 347
METRIC RANK
59.1%
COLLEGE, UNDER 1 YEAR
0.0/ 100
METRIC RATING
293rd/ 347
METRIC RANK
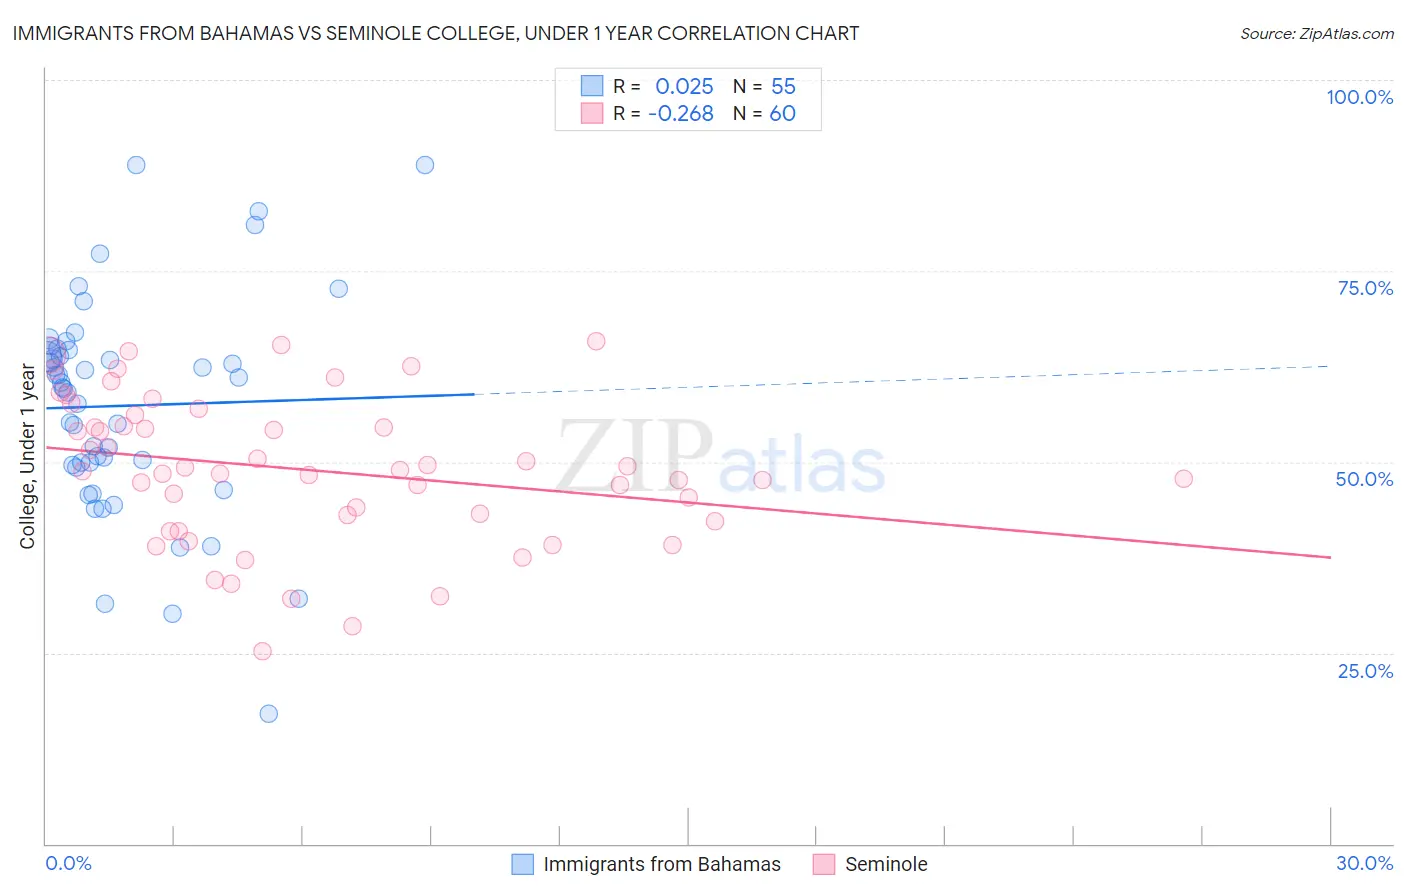
Immigrants from Bahamas vs Seminole College, Under 1 year Correlation Chart
The statistical analysis conducted on geographies consisting of 104,668,341 people shows no correlation between the proportion of Immigrants from Bahamas and percentage of population with at least college, under 1 year education in the United States with a correlation coefficient (R) of 0.025 and weighted average of 61.1%. Similarly, the statistical analysis conducted on geographies consisting of 118,314,121 people shows a weak negative correlation between the proportion of Seminole and percentage of population with at least college, under 1 year education in the United States with a correlation coefficient (R) of -0.268 and weighted average of 59.1%, a difference of 3.3%.
College, Under 1 year Correlation Summary
| Measurement | Immigrants from Bahamas | Seminole |
| Minimum | 17.1% | 25.3% |
| Maximum | 88.9% | 65.8% |
| Range | 71.8% | 40.5% |
| Mean | 57.3% | 49.0% |
| Median | 59.8% | 48.8% |
| Interquartile 25% (IQ1) | 49.6% | 42.7% |
| Interquartile 75% (IQ3) | 64.6% | 55.4% |
| Interquartile Range (IQR) | 15.0% | 12.7% |
| Standard Deviation (Sample) | 14.1% | 9.6% |
| Standard Deviation (Population) | 14.0% | 9.5% |
Similar Demographics by College, Under 1 year
Demographics Similar to Immigrants from Bahamas by College, Under 1 year
In terms of college, under 1 year, the demographic groups most similar to Immigrants from Bahamas are Trinidadian and Tobagonian (61.1%, a difference of 0.0%), Shoshone (61.1%, a difference of 0.060%), Barbadian (61.1%, a difference of 0.070%), African (61.1%, a difference of 0.11%), and Alaskan Athabascan (61.0%, a difference of 0.12%).
| Demographics | Rating | Rank | College, Under 1 year |
| Immigrants | Bangladesh | 0.3 /100 | #258 | Tragic 61.3% |
| Indonesians | 0.3 /100 | #259 | Tragic 61.2% |
| Blackfeet | 0.3 /100 | #260 | Tragic 61.1% |
| Africans | 0.3 /100 | #261 | Tragic 61.1% |
| Barbadians | 0.2 /100 | #262 | Tragic 61.1% |
| Shoshone | 0.2 /100 | #263 | Tragic 61.1% |
| Trinidadians and Tobagonians | 0.2 /100 | #264 | Tragic 61.1% |
| Immigrants | Bahamas | 0.2 /100 | #265 | Tragic 61.1% |
| Alaskan Athabascans | 0.2 /100 | #266 | Tragic 61.0% |
| Americans | 0.2 /100 | #267 | Tragic 61.0% |
| Immigrants | Trinidad and Tobago | 0.1 /100 | #268 | Tragic 60.7% |
| Immigrants | West Indies | 0.1 /100 | #269 | Tragic 60.6% |
| Cheyenne | 0.1 /100 | #270 | Tragic 60.6% |
| U.S. Virgin Islanders | 0.1 /100 | #271 | Tragic 60.6% |
| Jamaicans | 0.1 /100 | #272 | Tragic 60.5% |
Demographics Similar to Seminole by College, Under 1 year
In terms of college, under 1 year, the demographic groups most similar to Seminole are Immigrants from Belize (59.1%, a difference of 0.020%), Immigrants from Grenada (59.1%, a difference of 0.12%), Central American Indian (59.0%, a difference of 0.16%), Nicaraguan (59.2%, a difference of 0.18%), and Guyanese (59.0%, a difference of 0.21%).
| Demographics | Rating | Rank | College, Under 1 year |
| British West Indians | 0.0 /100 | #286 | Tragic 59.5% |
| Sioux | 0.0 /100 | #287 | Tragic 59.4% |
| Blacks/African Americans | 0.0 /100 | #288 | Tragic 59.4% |
| Choctaw | 0.0 /100 | #289 | Tragic 59.3% |
| Ecuadorians | 0.0 /100 | #290 | Tragic 59.3% |
| Creek | 0.0 /100 | #291 | Tragic 59.3% |
| Nicaraguans | 0.0 /100 | #292 | Tragic 59.2% |
| Seminole | 0.0 /100 | #293 | Tragic 59.1% |
| Immigrants | Belize | 0.0 /100 | #294 | Tragic 59.1% |
| Immigrants | Grenada | 0.0 /100 | #295 | Tragic 59.1% |
| Central American Indians | 0.0 /100 | #296 | Tragic 59.0% |
| Guyanese | 0.0 /100 | #297 | Tragic 59.0% |
| Immigrants | Ecuador | 0.0 /100 | #298 | Tragic 58.7% |
| Cubans | 0.0 /100 | #299 | Tragic 58.6% |
| Immigrants | Guyana | 0.0 /100 | #300 | Tragic 58.5% |