Immigrants from Bahamas vs Immigrants from Pakistan College, Under 1 year
COMPARE
Immigrants from Bahamas
Immigrants from Pakistan
College, Under 1 year
College, Under 1 year Comparison
Immigrants from Bahamas
Immigrants from Pakistan
61.1%
COLLEGE, UNDER 1 YEAR
0.2/ 100
METRIC RATING
265th/ 347
METRIC RANK
68.0%
COLLEGE, UNDER 1 YEAR
97.5/ 100
METRIC RATING
95th/ 347
METRIC RANK
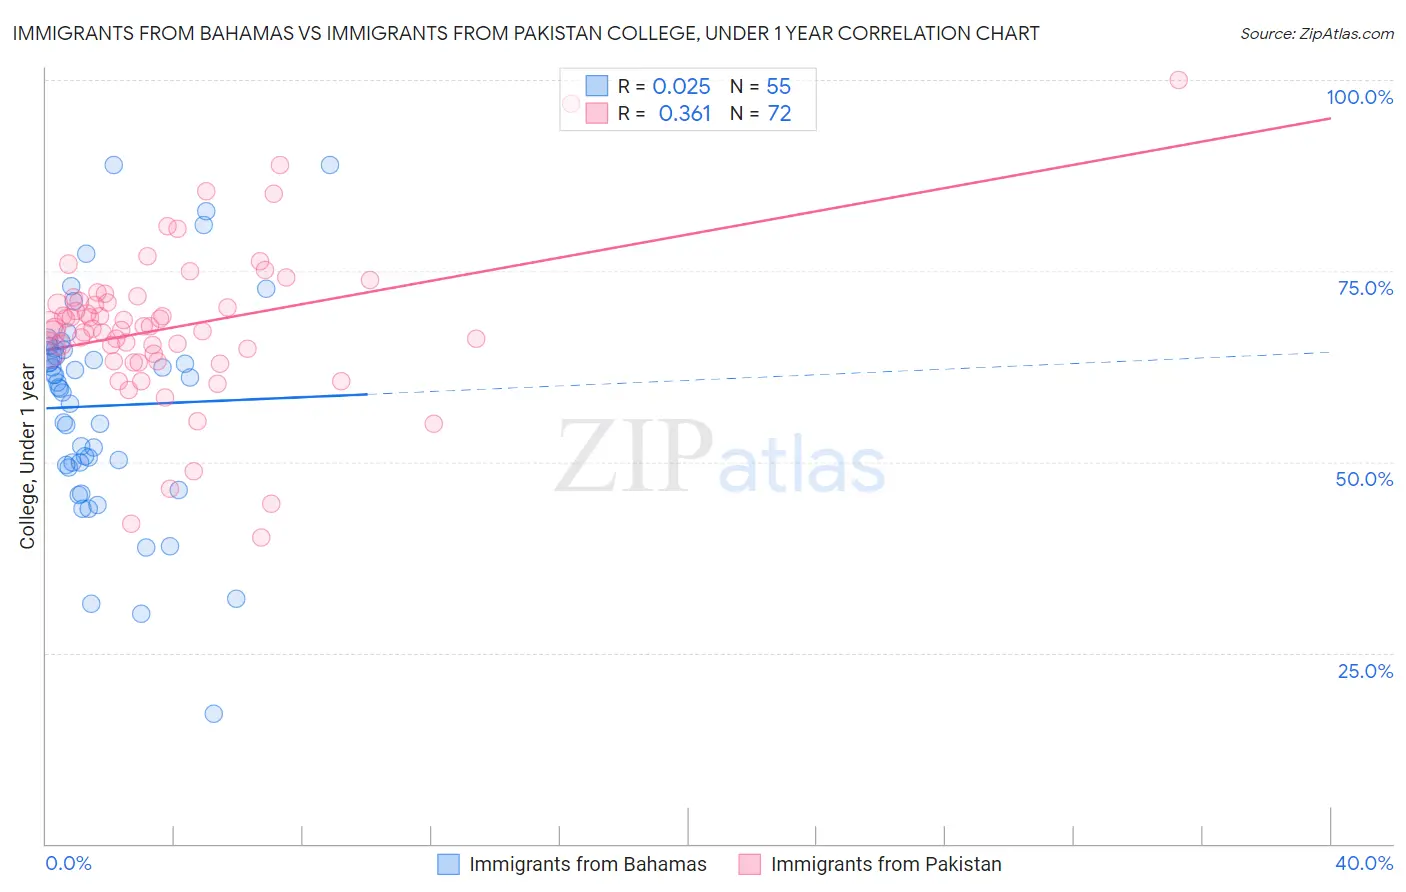
Immigrants from Bahamas vs Immigrants from Pakistan College, Under 1 year Correlation Chart
The statistical analysis conducted on geographies consisting of 104,668,341 people shows no correlation between the proportion of Immigrants from Bahamas and percentage of population with at least college, under 1 year education in the United States with a correlation coefficient (R) of 0.025 and weighted average of 61.1%. Similarly, the statistical analysis conducted on geographies consisting of 283,911,472 people shows a mild positive correlation between the proportion of Immigrants from Pakistan and percentage of population with at least college, under 1 year education in the United States with a correlation coefficient (R) of 0.361 and weighted average of 68.0%, a difference of 11.4%.
College, Under 1 year Correlation Summary
| Measurement | Immigrants from Bahamas | Immigrants from Pakistan |
| Minimum | 17.1% | 40.0% |
| Maximum | 88.9% | 100.0% |
| Range | 71.8% | 60.0% |
| Mean | 57.3% | 67.7% |
| Median | 59.8% | 67.6% |
| Interquartile 25% (IQ1) | 49.6% | 63.6% |
| Interquartile 75% (IQ3) | 64.6% | 71.2% |
| Interquartile Range (IQR) | 15.0% | 7.6% |
| Standard Deviation (Sample) | 14.1% | 10.3% |
| Standard Deviation (Population) | 14.0% | 10.2% |
Similar Demographics by College, Under 1 year
Demographics Similar to Immigrants from Bahamas by College, Under 1 year
In terms of college, under 1 year, the demographic groups most similar to Immigrants from Bahamas are Trinidadian and Tobagonian (61.1%, a difference of 0.0%), Shoshone (61.1%, a difference of 0.060%), Barbadian (61.1%, a difference of 0.070%), African (61.1%, a difference of 0.11%), and Alaskan Athabascan (61.0%, a difference of 0.12%).
| Demographics | Rating | Rank | College, Under 1 year |
| Immigrants | Bangladesh | 0.3 /100 | #258 | Tragic 61.3% |
| Indonesians | 0.3 /100 | #259 | Tragic 61.2% |
| Blackfeet | 0.3 /100 | #260 | Tragic 61.1% |
| Africans | 0.3 /100 | #261 | Tragic 61.1% |
| Barbadians | 0.2 /100 | #262 | Tragic 61.1% |
| Shoshone | 0.2 /100 | #263 | Tragic 61.1% |
| Trinidadians and Tobagonians | 0.2 /100 | #264 | Tragic 61.1% |
| Immigrants | Bahamas | 0.2 /100 | #265 | Tragic 61.1% |
| Alaskan Athabascans | 0.2 /100 | #266 | Tragic 61.0% |
| Americans | 0.2 /100 | #267 | Tragic 61.0% |
| Immigrants | Trinidad and Tobago | 0.1 /100 | #268 | Tragic 60.7% |
| Immigrants | West Indies | 0.1 /100 | #269 | Tragic 60.6% |
| Cheyenne | 0.1 /100 | #270 | Tragic 60.6% |
| U.S. Virgin Islanders | 0.1 /100 | #271 | Tragic 60.6% |
| Jamaicans | 0.1 /100 | #272 | Tragic 60.5% |
Demographics Similar to Immigrants from Pakistan by College, Under 1 year
In terms of college, under 1 year, the demographic groups most similar to Immigrants from Pakistan are Jordanian (68.0%, a difference of 0.030%), Immigrants from Ethiopia (68.0%, a difference of 0.060%), Armenian (68.1%, a difference of 0.090%), Paraguayan (67.9%, a difference of 0.17%), and Immigrants from Bolivia (67.9%, a difference of 0.18%).
| Demographics | Rating | Rank | College, Under 1 year |
| Croatians | 98.2 /100 | #88 | Exceptional 68.3% |
| Ethiopians | 98.2 /100 | #89 | Exceptional 68.3% |
| Icelanders | 98.1 /100 | #90 | Exceptional 68.3% |
| Europeans | 98.1 /100 | #91 | Exceptional 68.2% |
| Luxembourgers | 98.1 /100 | #92 | Exceptional 68.2% |
| Romanians | 97.9 /100 | #93 | Exceptional 68.2% |
| Armenians | 97.7 /100 | #94 | Exceptional 68.1% |
| Immigrants | Pakistan | 97.5 /100 | #95 | Exceptional 68.0% |
| Jordanians | 97.4 /100 | #96 | Exceptional 68.0% |
| Immigrants | Ethiopia | 97.3 /100 | #97 | Exceptional 68.0% |
| Paraguayans | 97.1 /100 | #98 | Exceptional 67.9% |
| Immigrants | Bolivia | 97.0 /100 | #99 | Exceptional 67.9% |
| Immigrants | Argentina | 97.0 /100 | #100 | Exceptional 67.9% |
| Immigrants | Eastern Europe | 96.9 /100 | #101 | Exceptional 67.9% |
| Palestinians | 96.9 /100 | #102 | Exceptional 67.9% |