Immigrants from Bahamas vs Native Hawaiian High School Diploma
COMPARE
Immigrants from Bahamas
Native Hawaiian
High School Diploma
High School Diploma Comparison
Immigrants from Bahamas
Native Hawaiians
88.0%
HIGH SCHOOL DIPLOMA
2.9/ 100
METRIC RATING
235th/ 347
METRIC RANK
90.8%
HIGH SCHOOL DIPLOMA
99.3/ 100
METRIC RATING
77th/ 347
METRIC RANK
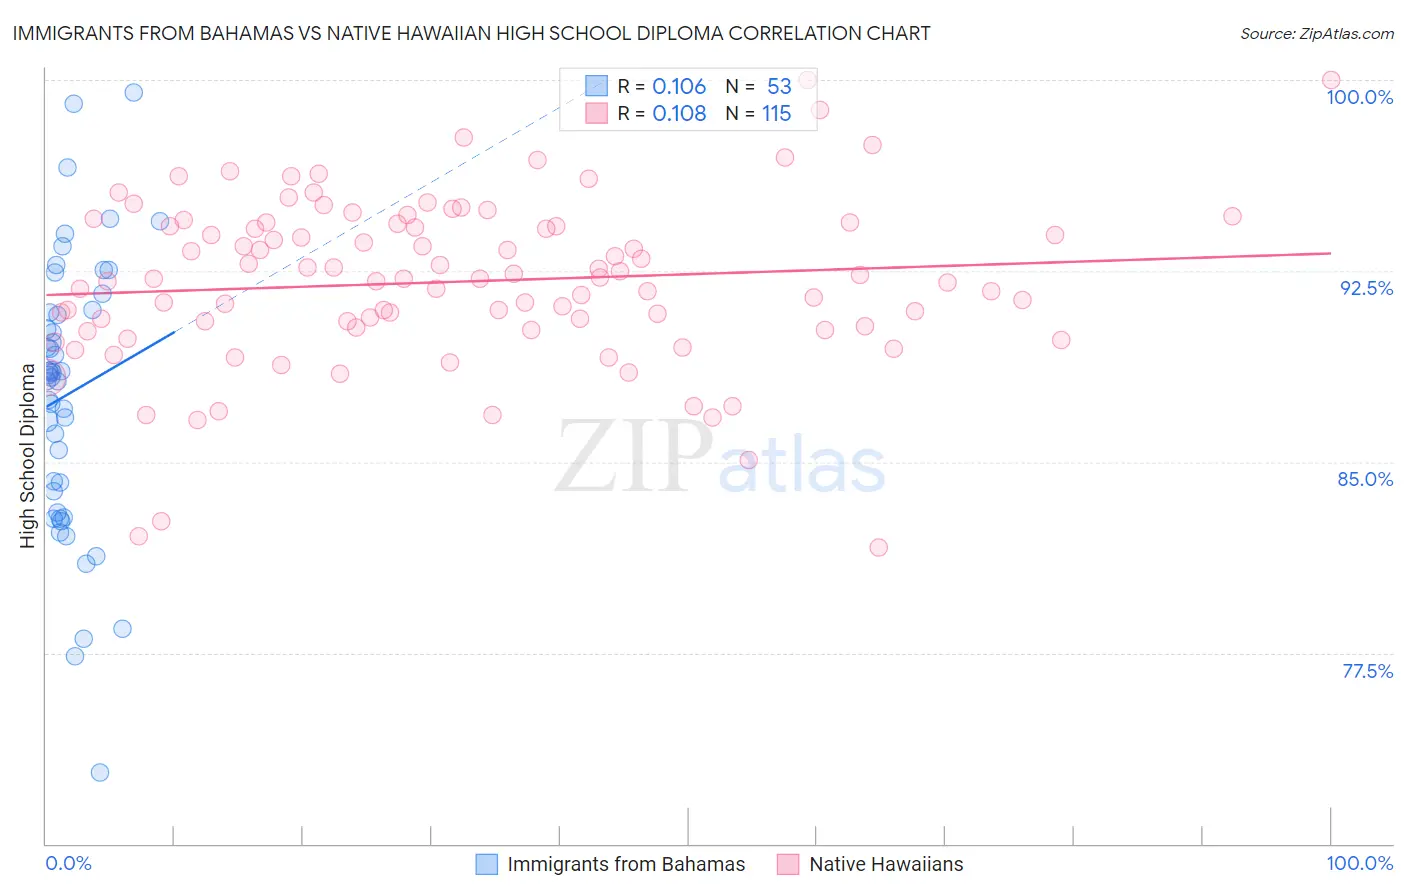
Immigrants from Bahamas vs Native Hawaiian High School Diploma Correlation Chart
The statistical analysis conducted on geographies consisting of 104,665,790 people shows a poor positive correlation between the proportion of Immigrants from Bahamas and percentage of population with at least high school diploma education in the United States with a correlation coefficient (R) of 0.106 and weighted average of 88.0%. Similarly, the statistical analysis conducted on geographies consisting of 332,118,930 people shows a poor positive correlation between the proportion of Native Hawaiians and percentage of population with at least high school diploma education in the United States with a correlation coefficient (R) of 0.108 and weighted average of 90.8%, a difference of 3.2%.
High School Diploma Correlation Summary
| Measurement | Immigrants from Bahamas | Native Hawaiian |
| Minimum | 72.8% | 81.6% |
| Maximum | 99.5% | 100.0% |
| Range | 26.7% | 18.4% |
| Mean | 87.7% | 92.1% |
| Median | 88.4% | 92.2% |
| Interquartile 25% (IQ1) | 83.4% | 90.3% |
| Interquartile 75% (IQ3) | 90.9% | 94.4% |
| Interquartile Range (IQR) | 7.5% | 4.1% |
| Standard Deviation (Sample) | 5.4% | 3.3% |
| Standard Deviation (Population) | 5.3% | 3.3% |
Similar Demographics by High School Diploma
Demographics Similar to Immigrants from Bahamas by High School Diploma
In terms of high school diploma, the demographic groups most similar to Immigrants from Bahamas are Immigrants from Panama (88.0%, a difference of 0.020%), Immigrants from Thailand (88.0%, a difference of 0.020%), Subsaharan African (87.9%, a difference of 0.020%), Taiwanese (87.9%, a difference of 0.030%), and Sioux (87.9%, a difference of 0.030%).
| Demographics | Rating | Rank | High School Diploma |
| Kiowa | 5.3 /100 | #228 | Tragic 88.2% |
| Nigerians | 5.2 /100 | #229 | Tragic 88.2% |
| Blackfeet | 4.2 /100 | #230 | Tragic 88.1% |
| Colombians | 3.8 /100 | #231 | Tragic 88.1% |
| Immigrants | Middle Africa | 3.4 /100 | #232 | Tragic 88.0% |
| Immigrants | Panama | 3.1 /100 | #233 | Tragic 88.0% |
| Immigrants | Thailand | 3.1 /100 | #234 | Tragic 88.0% |
| Immigrants | Bahamas | 2.9 /100 | #235 | Tragic 88.0% |
| Sub-Saharan Africans | 2.8 /100 | #236 | Tragic 87.9% |
| Taiwanese | 2.8 /100 | #237 | Tragic 87.9% |
| Sioux | 2.7 /100 | #238 | Tragic 87.9% |
| South Americans | 2.7 /100 | #239 | Tragic 87.9% |
| Comanche | 2.2 /100 | #240 | Tragic 87.9% |
| Immigrants | Uzbekistan | 2.1 /100 | #241 | Tragic 87.8% |
| Cheyenne | 2.1 /100 | #242 | Tragic 87.8% |
Demographics Similar to Native Hawaiians by High School Diploma
In terms of high school diploma, the demographic groups most similar to Native Hawaiians are Burmese (90.8%, a difference of 0.0%), Hungarian (90.8%, a difference of 0.010%), Immigrants from Denmark (90.8%, a difference of 0.010%), Cambodian (90.8%, a difference of 0.020%), and Immigrants from England (90.8%, a difference of 0.020%).
| Demographics | Rating | Rank | High School Diploma |
| Immigrants | Latvia | 99.5 /100 | #70 | Exceptional 90.9% |
| Alaskan Athabascans | 99.4 /100 | #71 | Exceptional 90.9% |
| Soviet Union | 99.4 /100 | #72 | Exceptional 90.9% |
| Immigrants | South Central Asia | 99.4 /100 | #73 | Exceptional 90.9% |
| Immigrants | Czechoslovakia | 99.4 /100 | #74 | Exceptional 90.9% |
| Cambodians | 99.4 /100 | #75 | Exceptional 90.8% |
| Hungarians | 99.3 /100 | #76 | Exceptional 90.8% |
| Native Hawaiians | 99.3 /100 | #77 | Exceptional 90.8% |
| Burmese | 99.3 /100 | #78 | Exceptional 90.8% |
| Immigrants | Denmark | 99.3 /100 | #79 | Exceptional 90.8% |
| Immigrants | England | 99.3 /100 | #80 | Exceptional 90.8% |
| Immigrants | Switzerland | 99.3 /100 | #81 | Exceptional 90.8% |
| Scotch-Irish | 99.2 /100 | #82 | Exceptional 90.8% |
| Immigrants | Moldova | 99.2 /100 | #83 | Exceptional 90.7% |
| Immigrants | Saudi Arabia | 99.1 /100 | #84 | Exceptional 90.7% |