Costa Rican vs Native Hawaiian College, Under 1 year
COMPARE
Costa Rican
Native Hawaiian
College, Under 1 year
College, Under 1 year Comparison
Costa Ricans
Native Hawaiians
64.4%
COLLEGE, UNDER 1 YEAR
19.6/ 100
METRIC RATING
197th/ 347
METRIC RANK
63.9%
COLLEGE, UNDER 1 YEAR
10.6/ 100
METRIC RATING
211th/ 347
METRIC RANK
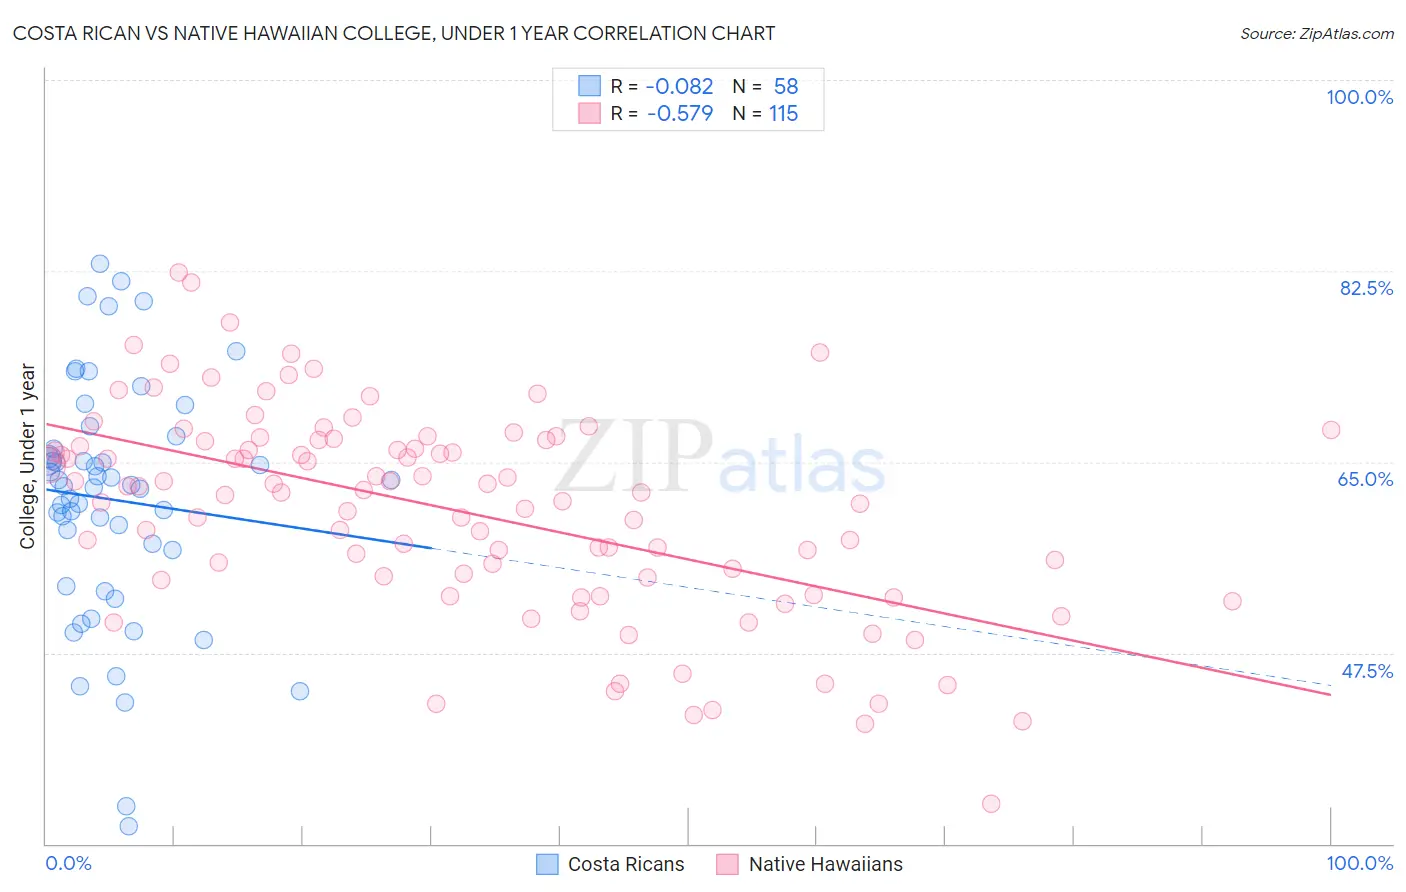
Costa Rican vs Native Hawaiian College, Under 1 year Correlation Chart
The statistical analysis conducted on geographies consisting of 253,601,310 people shows a slight negative correlation between the proportion of Costa Ricans and percentage of population with at least college, under 1 year education in the United States with a correlation coefficient (R) of -0.082 and weighted average of 64.4%. Similarly, the statistical analysis conducted on geographies consisting of 332,118,930 people shows a substantial negative correlation between the proportion of Native Hawaiians and percentage of population with at least college, under 1 year education in the United States with a correlation coefficient (R) of -0.579 and weighted average of 63.9%, a difference of 0.81%.
College, Under 1 year Correlation Summary
| Measurement | Costa Rican | Native Hawaiian |
| Minimum | 31.6% | 33.7% |
| Maximum | 83.1% | 82.3% |
| Range | 51.5% | 48.7% |
| Mean | 61.5% | 60.5% |
| Median | 62.8% | 62.2% |
| Interquartile 25% (IQ1) | 56.9% | 54.4% |
| Interquartile 75% (IQ3) | 66.2% | 67.0% |
| Interquartile Range (IQR) | 9.3% | 12.6% |
| Standard Deviation (Sample) | 10.9% | 9.4% |
| Standard Deviation (Population) | 10.8% | 9.4% |
Demographics Similar to Costa Ricans and Native Hawaiians by College, Under 1 year
In terms of college, under 1 year, the demographic groups most similar to Costa Ricans are Tongan (64.5%, a difference of 0.11%), Tsimshian (64.3%, a difference of 0.13%), Immigrants from South Eastern Asia (64.5%, a difference of 0.17%), Panamanian (64.3%, a difference of 0.19%), and Nigerian (64.3%, a difference of 0.22%). Similarly, the demographic groups most similar to Native Hawaiians are Immigrants from Middle Africa (63.9%, a difference of 0.010%), Ghanaian (63.9%, a difference of 0.070%), Puget Sound Salish (63.9%, a difference of 0.080%), Immigrants from Vietnam (64.0%, a difference of 0.17%), and Immigrants from South America (63.8%, a difference of 0.19%).
| Demographics | Rating | Rank | College, Under 1 year |
| Immigrants | Cameroon | 24.6 /100 | #194 | Fair 64.6% |
| Immigrants | South Eastern Asia | 22.1 /100 | #195 | Fair 64.5% |
| Tongans | 21.2 /100 | #196 | Fair 64.5% |
| Costa Ricans | 19.6 /100 | #197 | Poor 64.4% |
| Tsimshian | 17.9 /100 | #198 | Poor 64.3% |
| Panamanians | 17.0 /100 | #199 | Poor 64.3% |
| Nigerians | 16.7 /100 | #200 | Poor 64.3% |
| French Canadians | 16.3 /100 | #201 | Poor 64.2% |
| South Americans | 16.2 /100 | #202 | Poor 64.2% |
| Uruguayans | 15.6 /100 | #203 | Poor 64.2% |
| Immigrants | Zaire | 14.6 /100 | #204 | Poor 64.1% |
| Peruvians | 13.7 /100 | #205 | Poor 64.1% |
| Whites/Caucasians | 12.8 /100 | #206 | Poor 64.0% |
| Colombians | 12.4 /100 | #207 | Poor 64.0% |
| Immigrants | Vietnam | 12.1 /100 | #208 | Poor 64.0% |
| Puget Sound Salish | 11.3 /100 | #209 | Poor 63.9% |
| Ghanaians | 11.2 /100 | #210 | Poor 63.9% |
| Native Hawaiians | 10.6 /100 | #211 | Poor 63.9% |
| Immigrants | Middle Africa | 10.5 /100 | #212 | Poor 63.9% |
| Immigrants | South America | 9.1 /100 | #213 | Tragic 63.8% |
| Immigrants | Nigeria | 8.8 /100 | #214 | Tragic 63.7% |