Immigrants from Bahamas vs Immigrants from Zaire College, Under 1 year
COMPARE
Immigrants from Bahamas
Immigrants from Zaire
College, Under 1 year
College, Under 1 year Comparison
Immigrants from Bahamas
Immigrants from Zaire
61.1%
COLLEGE, UNDER 1 YEAR
0.2/ 100
METRIC RATING
265th/ 347
METRIC RANK
64.1%
COLLEGE, UNDER 1 YEAR
14.6/ 100
METRIC RATING
204th/ 347
METRIC RANK
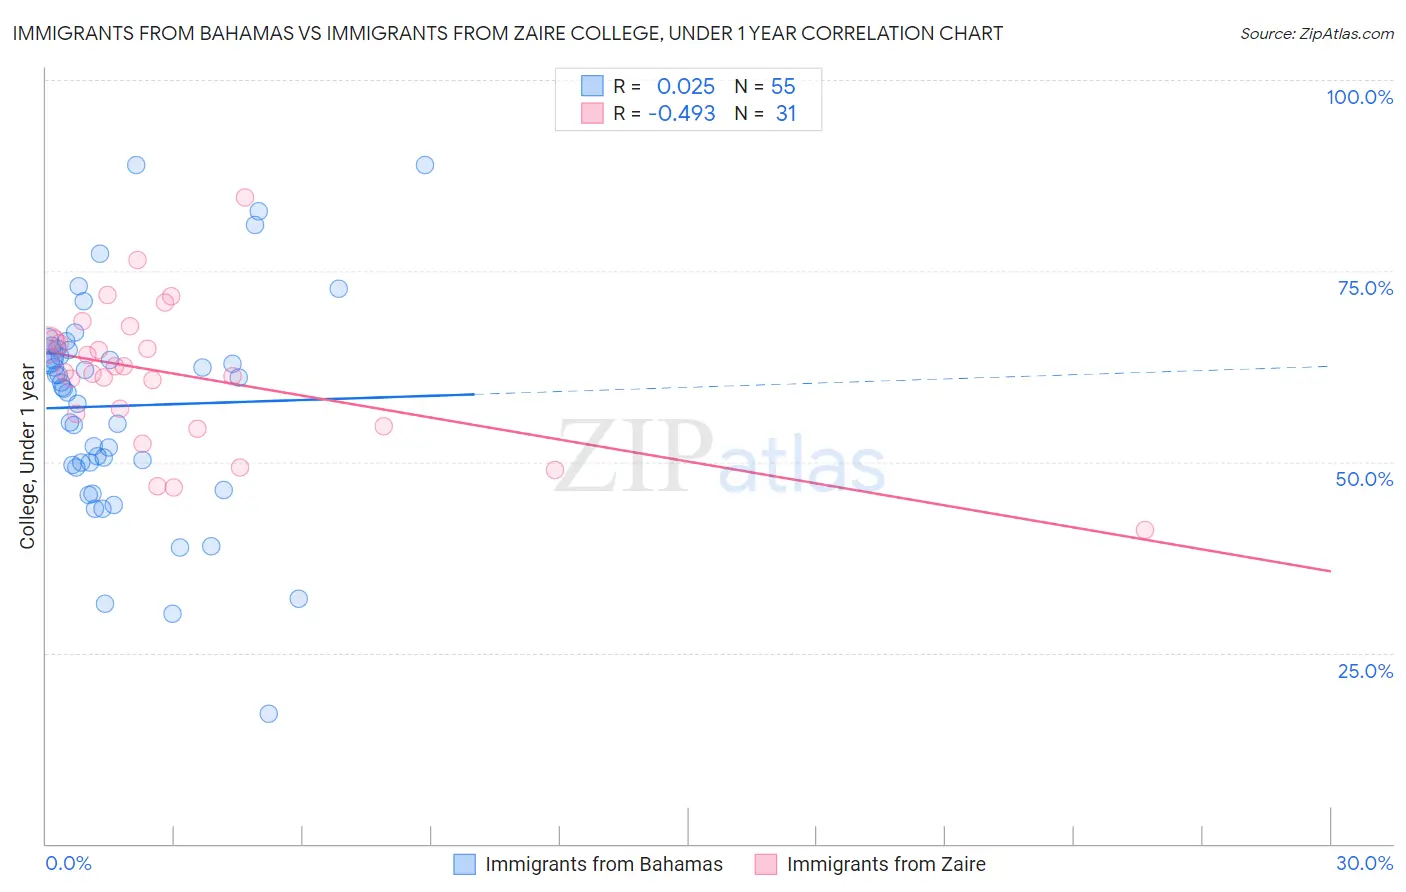
Immigrants from Bahamas vs Immigrants from Zaire College, Under 1 year Correlation Chart
The statistical analysis conducted on geographies consisting of 104,668,341 people shows no correlation between the proportion of Immigrants from Bahamas and percentage of population with at least college, under 1 year education in the United States with a correlation coefficient (R) of 0.025 and weighted average of 61.1%. Similarly, the statistical analysis conducted on geographies consisting of 107,255,700 people shows a moderate negative correlation between the proportion of Immigrants from Zaire and percentage of population with at least college, under 1 year education in the United States with a correlation coefficient (R) of -0.493 and weighted average of 64.1%, a difference of 5.1%.
College, Under 1 year Correlation Summary
| Measurement | Immigrants from Bahamas | Immigrants from Zaire |
| Minimum | 17.1% | 41.0% |
| Maximum | 88.9% | 84.6% |
| Range | 71.8% | 43.5% |
| Mean | 57.3% | 61.3% |
| Median | 59.8% | 61.7% |
| Interquartile 25% (IQ1) | 49.6% | 54.7% |
| Interquartile 75% (IQ3) | 64.6% | 66.0% |
| Interquartile Range (IQR) | 15.0% | 11.3% |
| Standard Deviation (Sample) | 14.1% | 9.3% |
| Standard Deviation (Population) | 14.0% | 9.2% |
Similar Demographics by College, Under 1 year
Demographics Similar to Immigrants from Bahamas by College, Under 1 year
In terms of college, under 1 year, the demographic groups most similar to Immigrants from Bahamas are Trinidadian and Tobagonian (61.1%, a difference of 0.0%), Shoshone (61.1%, a difference of 0.060%), Barbadian (61.1%, a difference of 0.070%), African (61.1%, a difference of 0.11%), and Alaskan Athabascan (61.0%, a difference of 0.12%).
| Demographics | Rating | Rank | College, Under 1 year |
| Immigrants | Bangladesh | 0.3 /100 | #258 | Tragic 61.3% |
| Indonesians | 0.3 /100 | #259 | Tragic 61.2% |
| Blackfeet | 0.3 /100 | #260 | Tragic 61.1% |
| Africans | 0.3 /100 | #261 | Tragic 61.1% |
| Barbadians | 0.2 /100 | #262 | Tragic 61.1% |
| Shoshone | 0.2 /100 | #263 | Tragic 61.1% |
| Trinidadians and Tobagonians | 0.2 /100 | #264 | Tragic 61.1% |
| Immigrants | Bahamas | 0.2 /100 | #265 | Tragic 61.1% |
| Alaskan Athabascans | 0.2 /100 | #266 | Tragic 61.0% |
| Americans | 0.2 /100 | #267 | Tragic 61.0% |
| Immigrants | Trinidad and Tobago | 0.1 /100 | #268 | Tragic 60.7% |
| Immigrants | West Indies | 0.1 /100 | #269 | Tragic 60.6% |
| Cheyenne | 0.1 /100 | #270 | Tragic 60.6% |
| U.S. Virgin Islanders | 0.1 /100 | #271 | Tragic 60.6% |
| Jamaicans | 0.1 /100 | #272 | Tragic 60.5% |
Demographics Similar to Immigrants from Zaire by College, Under 1 year
In terms of college, under 1 year, the demographic groups most similar to Immigrants from Zaire are Peruvian (64.1%, a difference of 0.080%), Uruguayan (64.2%, a difference of 0.090%), French Canadian (64.2%, a difference of 0.14%), South American (64.2%, a difference of 0.14%), and White/Caucasian (64.0%, a difference of 0.17%).
| Demographics | Rating | Rank | College, Under 1 year |
| Costa Ricans | 19.6 /100 | #197 | Poor 64.4% |
| Tsimshian | 17.9 /100 | #198 | Poor 64.3% |
| Panamanians | 17.0 /100 | #199 | Poor 64.3% |
| Nigerians | 16.7 /100 | #200 | Poor 64.3% |
| French Canadians | 16.3 /100 | #201 | Poor 64.2% |
| South Americans | 16.2 /100 | #202 | Poor 64.2% |
| Uruguayans | 15.6 /100 | #203 | Poor 64.2% |
| Immigrants | Zaire | 14.6 /100 | #204 | Poor 64.1% |
| Peruvians | 13.7 /100 | #205 | Poor 64.1% |
| Whites/Caucasians | 12.8 /100 | #206 | Poor 64.0% |
| Colombians | 12.4 /100 | #207 | Poor 64.0% |
| Immigrants | Vietnam | 12.1 /100 | #208 | Poor 64.0% |
| Puget Sound Salish | 11.3 /100 | #209 | Poor 63.9% |
| Ghanaians | 11.2 /100 | #210 | Poor 63.9% |
| Native Hawaiians | 10.6 /100 | #211 | Poor 63.9% |