Immigrants from Armenia vs Immigrants from Morocco GED/Equivalency
COMPARE
Immigrants from Armenia
Immigrants from Morocco
GED/Equivalency
GED/Equivalency Comparison
Immigrants from Armenia
Immigrants from Morocco
83.1%
GED/EQUIVALENCY
0.2/ 100
METRIC RATING
262nd/ 347
METRIC RANK
86.1%
GED/EQUIVALENCY
69.5/ 100
METRIC RATING
160th/ 347
METRIC RANK
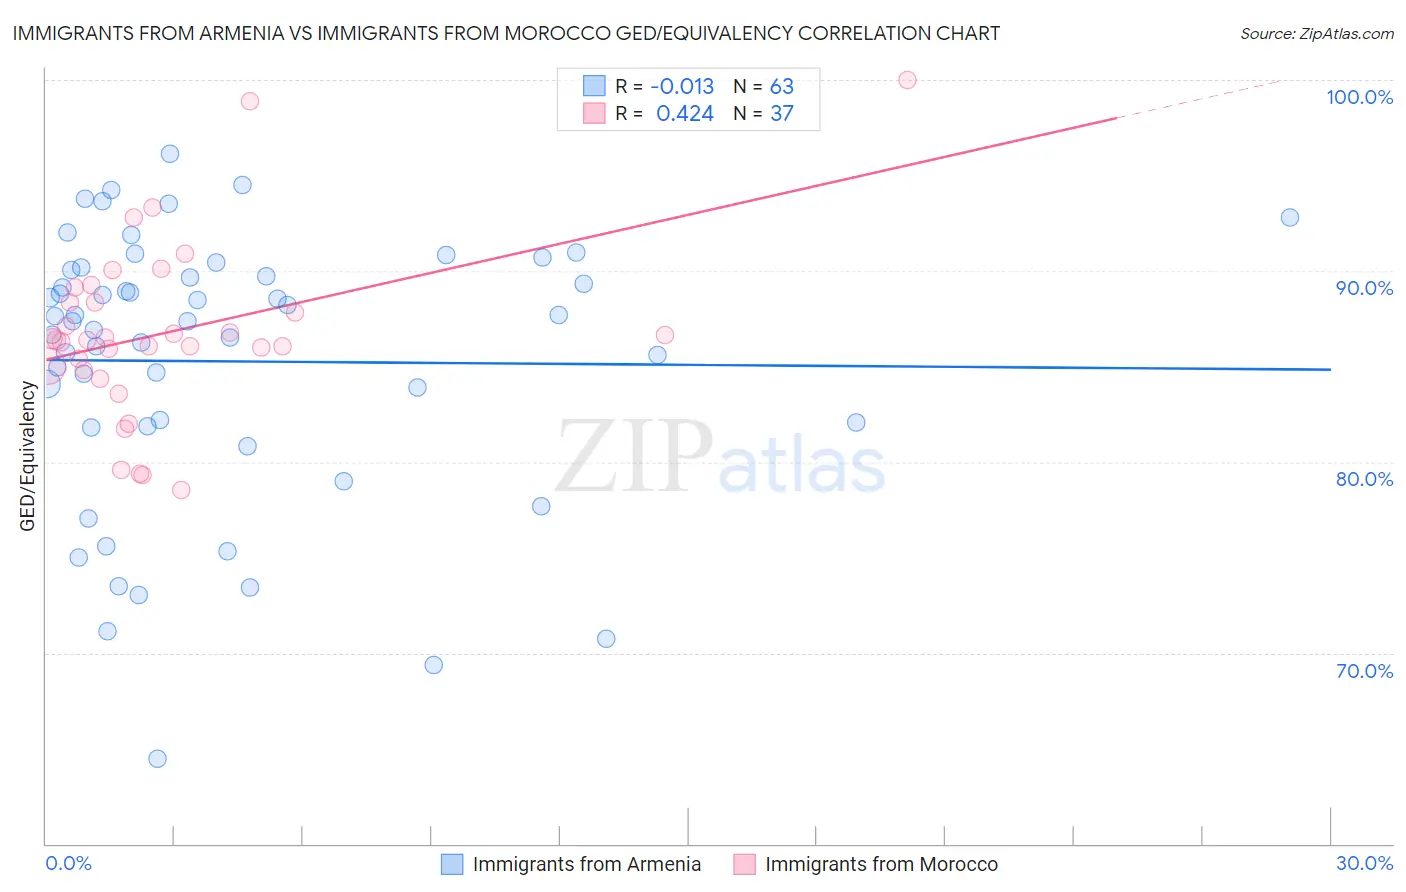
Immigrants from Armenia vs Immigrants from Morocco GED/Equivalency Correlation Chart
The statistical analysis conducted on geographies consisting of 97,725,183 people shows no correlation between the proportion of Immigrants from Armenia and percentage of population with at least ged/equivalency education in the United States with a correlation coefficient (R) of -0.013 and weighted average of 83.1%. Similarly, the statistical analysis conducted on geographies consisting of 178,912,438 people shows a moderate positive correlation between the proportion of Immigrants from Morocco and percentage of population with at least ged/equivalency education in the United States with a correlation coefficient (R) of 0.424 and weighted average of 86.1%, a difference of 3.6%.
GED/Equivalency Correlation Summary
| Measurement | Immigrants from Armenia | Immigrants from Morocco |
| Minimum | 64.5% | 78.5% |
| Maximum | 96.1% | 100.0% |
| Range | 31.7% | 21.5% |
| Mean | 85.3% | 86.8% |
| Median | 87.4% | 86.4% |
| Interquartile 25% (IQ1) | 81.9% | 84.9% |
| Interquartile 75% (IQ3) | 90.1% | 88.7% |
| Interquartile Range (IQR) | 8.2% | 3.8% |
| Standard Deviation (Sample) | 7.1% | 4.6% |
| Standard Deviation (Population) | 7.0% | 4.6% |
Similar Demographics by GED/Equivalency
Demographics Similar to Immigrants from Armenia by GED/Equivalency
In terms of ged/equivalency, the demographic groups most similar to Immigrants from Armenia are Inupiat (83.1%, a difference of 0.0%), Immigrants from Congo (83.1%, a difference of 0.010%), Bangladeshi (83.1%, a difference of 0.020%), West Indian (83.1%, a difference of 0.030%), and Kiowa (83.1%, a difference of 0.040%).
| Demographics | Rating | Rank | GED/Equivalency |
| Colville | 0.5 /100 | #255 | Tragic 83.4% |
| Africans | 0.5 /100 | #256 | Tragic 83.4% |
| Jamaicans | 0.4 /100 | #257 | Tragic 83.3% |
| Malaysians | 0.4 /100 | #258 | Tragic 83.3% |
| Immigrants | Vietnam | 0.3 /100 | #259 | Tragic 83.2% |
| Choctaw | 0.3 /100 | #260 | Tragic 83.1% |
| Inupiat | 0.2 /100 | #261 | Tragic 83.1% |
| Immigrants | Armenia | 0.2 /100 | #262 | Tragic 83.1% |
| Immigrants | Congo | 0.2 /100 | #263 | Tragic 83.1% |
| Bangladeshis | 0.2 /100 | #264 | Tragic 83.1% |
| West Indians | 0.2 /100 | #265 | Tragic 83.1% |
| Kiowa | 0.2 /100 | #266 | Tragic 83.1% |
| Trinidadians and Tobagonians | 0.2 /100 | #267 | Tragic 83.0% |
| Immigrants | Burma/Myanmar | 0.2 /100 | #268 | Tragic 83.0% |
| Hopi | 0.2 /100 | #269 | Tragic 83.0% |
Demographics Similar to Immigrants from Morocco by GED/Equivalency
In terms of ged/equivalency, the demographic groups most similar to Immigrants from Morocco are Immigrants from Syria (86.1%, a difference of 0.010%), Immigrants from Iraq (86.1%, a difference of 0.030%), German Russian (86.2%, a difference of 0.060%), Immigrants from Kenya (86.2%, a difference of 0.060%), and White/Caucasian (86.2%, a difference of 0.070%).
| Demographics | Rating | Rank | GED/Equivalency |
| Kenyans | 76.6 /100 | #153 | Good 86.3% |
| Armenians | 76.4 /100 | #154 | Good 86.3% |
| Iraqis | 75.2 /100 | #155 | Good 86.2% |
| Immigrants | Nepal | 73.3 /100 | #156 | Good 86.2% |
| Whites/Caucasians | 72.2 /100 | #157 | Good 86.2% |
| German Russians | 72.1 /100 | #158 | Good 86.2% |
| Immigrants | Kenya | 71.8 /100 | #159 | Good 86.2% |
| Immigrants | Morocco | 69.5 /100 | #160 | Good 86.1% |
| Immigrants | Syria | 69.3 /100 | #161 | Good 86.1% |
| Immigrants | Iraq | 68.1 /100 | #162 | Good 86.1% |
| Ugandans | 66.3 /100 | #163 | Good 86.1% |
| Venezuelans | 65.5 /100 | #164 | Good 86.0% |
| Alsatians | 64.3 /100 | #165 | Good 86.0% |
| Immigrants | Albania | 64.2 /100 | #166 | Good 86.0% |
| Ethiopians | 63.7 /100 | #167 | Good 86.0% |