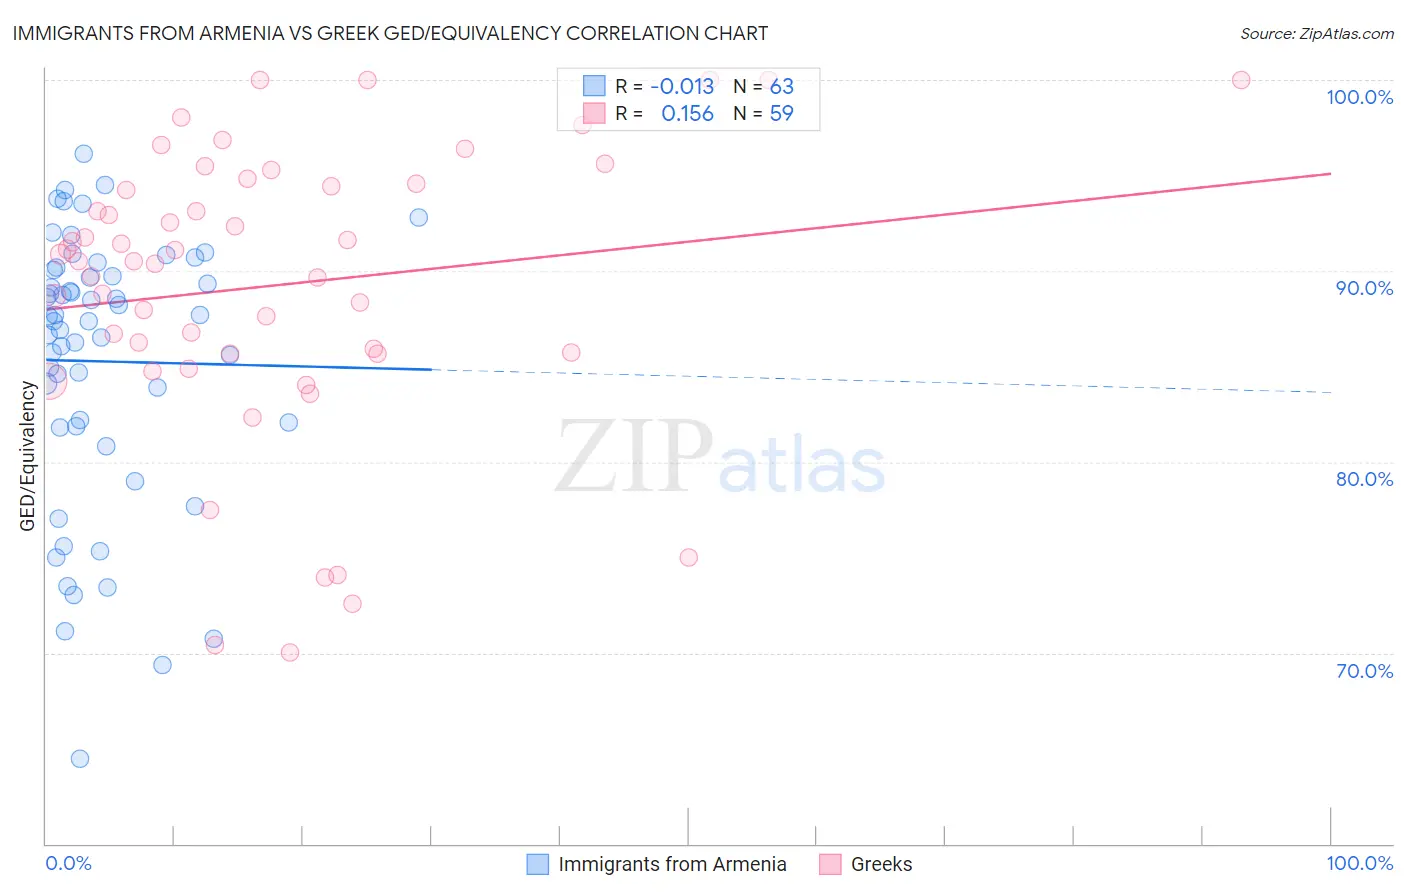
Immigrants from Armenia vs Greek GED/Equivalency
COMPARE
Immigrants from Armenia
Greek
GED/Equivalency
GED/Equivalency Comparison
Immigrants from Armenia
Greeks
83.1%
GED/EQUIVALENCY
0.2/ 100
METRIC RATING
262nd/ 347
METRIC RANK
88.1%
GED/EQUIVALENCY
99.5/ 100
METRIC RATING
48th/ 347
METRIC RANK
Immigrants from Armenia vs Greek GED/Equivalency Correlation Chart
The statistical analysis conducted on geographies consisting of 97,725,183 people shows no correlation between the proportion of Immigrants from Armenia and percentage of population with at least ged/equivalency education in the United States with a correlation coefficient (R) of -0.013 and weighted average of 83.1%. Similarly, the statistical analysis conducted on geographies consisting of 482,775,362 people shows a poor positive correlation between the proportion of Greeks and percentage of population with at least ged/equivalency education in the United States with a correlation coefficient (R) of 0.156 and weighted average of 88.1%, a difference of 6.0%.
GED/Equivalency Correlation Summary
| Measurement | Immigrants from Armenia | Greek |
| Minimum | 64.5% | 70.0% |
| Maximum | 96.1% | 100.0% |
| Range | 31.7% | 30.0% |
| Mean | 85.3% | 89.2% |
| Median | 87.4% | 90.5% |
| Interquartile 25% (IQ1) | 81.9% | 85.7% |
| Interquartile 75% (IQ3) | 90.1% | 94.6% |
| Interquartile Range (IQR) | 8.2% | 8.9% |
| Standard Deviation (Sample) | 7.1% | 7.5% |
| Standard Deviation (Population) | 7.0% | 7.4% |
Similar Demographics by GED/Equivalency
Demographics Similar to Immigrants from Armenia by GED/Equivalency
In terms of ged/equivalency, the demographic groups most similar to Immigrants from Armenia are Inupiat (83.1%, a difference of 0.0%), Immigrants from Congo (83.1%, a difference of 0.010%), Bangladeshi (83.1%, a difference of 0.020%), West Indian (83.1%, a difference of 0.030%), and Kiowa (83.1%, a difference of 0.040%).
| Demographics | Rating | Rank | GED/Equivalency |
| Colville | 0.5 /100 | #255 | Tragic 83.4% |
| Africans | 0.5 /100 | #256 | Tragic 83.4% |
| Jamaicans | 0.4 /100 | #257 | Tragic 83.3% |
| Malaysians | 0.4 /100 | #258 | Tragic 83.3% |
| Immigrants | Vietnam | 0.3 /100 | #259 | Tragic 83.2% |
| Choctaw | 0.3 /100 | #260 | Tragic 83.1% |
| Inupiat | 0.2 /100 | #261 | Tragic 83.1% |
| Immigrants | Armenia | 0.2 /100 | #262 | Tragic 83.1% |
| Immigrants | Congo | 0.2 /100 | #263 | Tragic 83.1% |
| Bangladeshis | 0.2 /100 | #264 | Tragic 83.1% |
| West Indians | 0.2 /100 | #265 | Tragic 83.1% |
| Kiowa | 0.2 /100 | #266 | Tragic 83.1% |
| Trinidadians and Tobagonians | 0.2 /100 | #267 | Tragic 83.0% |
| Immigrants | Burma/Myanmar | 0.2 /100 | #268 | Tragic 83.0% |
| Hopi | 0.2 /100 | #269 | Tragic 83.0% |
Demographics Similar to Greeks by GED/Equivalency
In terms of ged/equivalency, the demographic groups most similar to Greeks are Immigrants from Latvia (88.1%, a difference of 0.010%), Australian (88.1%, a difference of 0.010%), Immigrants from Switzerland (88.1%, a difference of 0.020%), Immigrants from Korea (88.1%, a difference of 0.020%), and Czech (88.1%, a difference of 0.030%).
| Demographics | Rating | Rank | GED/Equivalency |
| Finns | 99.6 /100 | #41 | Exceptional 88.2% |
| Cambodians | 99.6 /100 | #42 | Exceptional 88.2% |
| Immigrants | Scotland | 99.6 /100 | #43 | Exceptional 88.2% |
| Macedonians | 99.5 /100 | #44 | Exceptional 88.1% |
| Czechs | 99.5 /100 | #45 | Exceptional 88.1% |
| Immigrants | Switzerland | 99.5 /100 | #46 | Exceptional 88.1% |
| Immigrants | Latvia | 99.5 /100 | #47 | Exceptional 88.1% |
| Greeks | 99.5 /100 | #48 | Exceptional 88.1% |
| Australians | 99.5 /100 | #49 | Exceptional 88.1% |
| Immigrants | Korea | 99.5 /100 | #50 | Exceptional 88.1% |
| Immigrants | Netherlands | 99.4 /100 | #51 | Exceptional 88.0% |
| Zimbabweans | 99.4 /100 | #52 | Exceptional 88.0% |
| Immigrants | South Africa | 99.4 /100 | #53 | Exceptional 88.0% |
| Soviet Union | 99.4 /100 | #54 | Exceptional 88.0% |
| New Zealanders | 99.4 /100 | #55 | Exceptional 88.0% |