Immigrants from Armenia vs Yaqui GED/Equivalency
COMPARE
Immigrants from Armenia
Yaqui
GED/Equivalency
GED/Equivalency Comparison
Immigrants from Armenia
Yaqui
83.1%
GED/EQUIVALENCY
0.2/ 100
METRIC RATING
262nd/ 347
METRIC RANK
80.5%
GED/EQUIVALENCY
0.0/ 100
METRIC RATING
318th/ 347
METRIC RANK
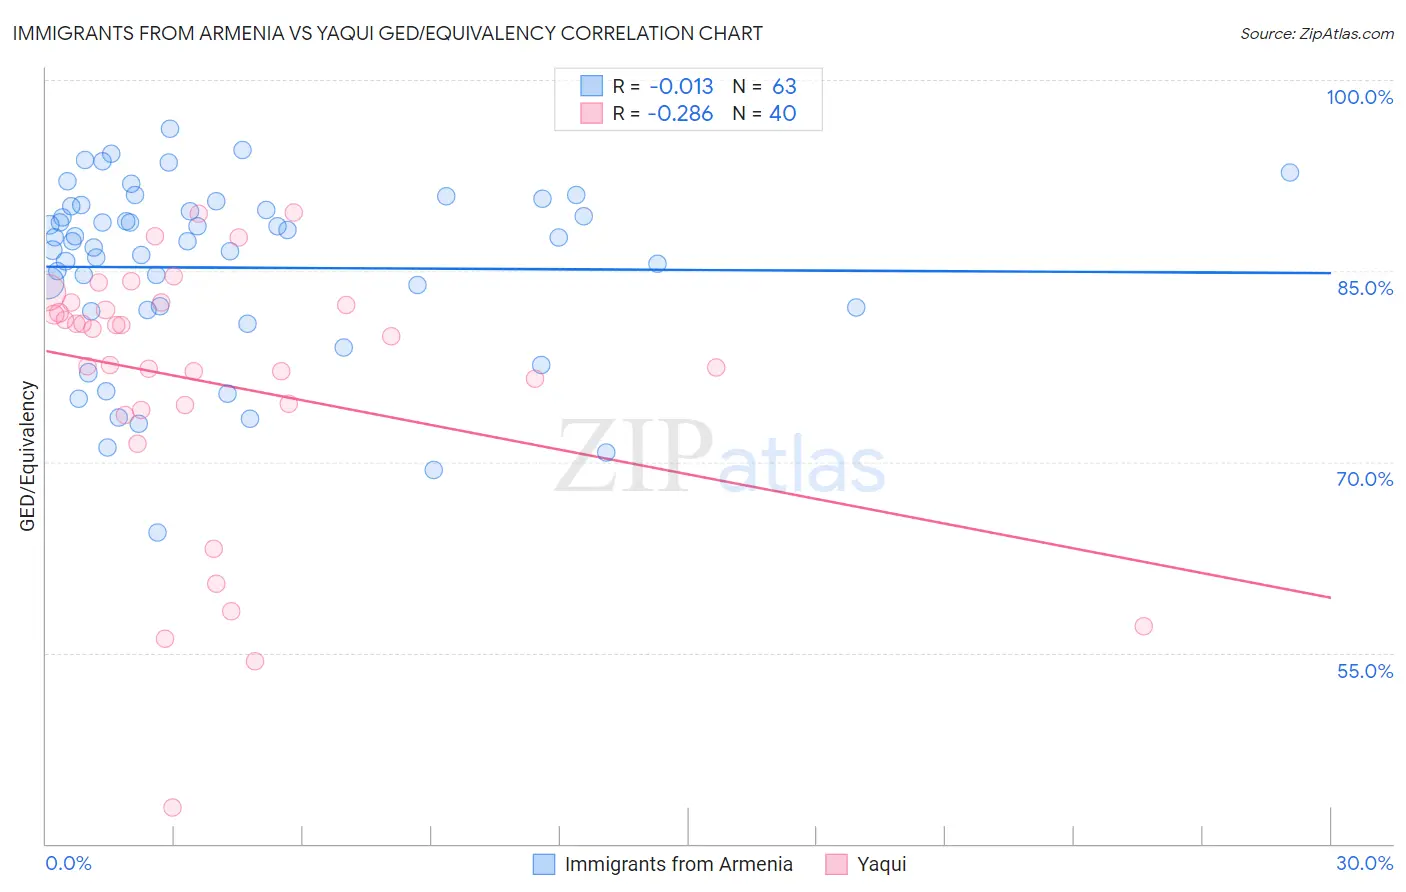
Immigrants from Armenia vs Yaqui GED/Equivalency Correlation Chart
The statistical analysis conducted on geographies consisting of 97,725,183 people shows no correlation between the proportion of Immigrants from Armenia and percentage of population with at least ged/equivalency education in the United States with a correlation coefficient (R) of -0.013 and weighted average of 83.1%. Similarly, the statistical analysis conducted on geographies consisting of 107,732,380 people shows a weak negative correlation between the proportion of Yaqui and percentage of population with at least ged/equivalency education in the United States with a correlation coefficient (R) of -0.286 and weighted average of 80.5%, a difference of 3.2%.
GED/Equivalency Correlation Summary
| Measurement | Immigrants from Armenia | Yaqui |
| Minimum | 64.5% | 42.9% |
| Maximum | 96.1% | 89.6% |
| Range | 31.7% | 46.7% |
| Mean | 85.3% | 76.2% |
| Median | 87.4% | 80.2% |
| Interquartile 25% (IQ1) | 81.9% | 74.3% |
| Interquartile 75% (IQ3) | 90.1% | 82.4% |
| Interquartile Range (IQR) | 8.2% | 8.1% |
| Standard Deviation (Sample) | 7.1% | 10.6% |
| Standard Deviation (Population) | 7.0% | 10.4% |
Similar Demographics by GED/Equivalency
Demographics Similar to Immigrants from Armenia by GED/Equivalency
In terms of ged/equivalency, the demographic groups most similar to Immigrants from Armenia are Inupiat (83.1%, a difference of 0.0%), Immigrants from Congo (83.1%, a difference of 0.010%), Bangladeshi (83.1%, a difference of 0.020%), West Indian (83.1%, a difference of 0.030%), and Kiowa (83.1%, a difference of 0.040%).
| Demographics | Rating | Rank | GED/Equivalency |
| Colville | 0.5 /100 | #255 | Tragic 83.4% |
| Africans | 0.5 /100 | #256 | Tragic 83.4% |
| Jamaicans | 0.4 /100 | #257 | Tragic 83.3% |
| Malaysians | 0.4 /100 | #258 | Tragic 83.3% |
| Immigrants | Vietnam | 0.3 /100 | #259 | Tragic 83.2% |
| Choctaw | 0.3 /100 | #260 | Tragic 83.1% |
| Inupiat | 0.2 /100 | #261 | Tragic 83.1% |
| Immigrants | Armenia | 0.2 /100 | #262 | Tragic 83.1% |
| Immigrants | Congo | 0.2 /100 | #263 | Tragic 83.1% |
| Bangladeshis | 0.2 /100 | #264 | Tragic 83.1% |
| West Indians | 0.2 /100 | #265 | Tragic 83.1% |
| Kiowa | 0.2 /100 | #266 | Tragic 83.1% |
| Trinidadians and Tobagonians | 0.2 /100 | #267 | Tragic 83.0% |
| Immigrants | Burma/Myanmar | 0.2 /100 | #268 | Tragic 83.0% |
| Hopi | 0.2 /100 | #269 | Tragic 83.0% |
Demographics Similar to Yaqui by GED/Equivalency
In terms of ged/equivalency, the demographic groups most similar to Yaqui are Immigrants from Belize (80.5%, a difference of 0.0%), Immigrants from Caribbean (80.5%, a difference of 0.020%), Central American Indian (80.6%, a difference of 0.13%), Apache (80.7%, a difference of 0.26%), and Immigrants from Cuba (80.2%, a difference of 0.41%).
| Demographics | Rating | Rank | GED/Equivalency |
| Natives/Alaskans | 0.0 /100 | #311 | Tragic 80.9% |
| Nicaraguans | 0.0 /100 | #312 | Tragic 80.9% |
| Cape Verdeans | 0.0 /100 | #313 | Tragic 80.9% |
| Belizeans | 0.0 /100 | #314 | Tragic 80.9% |
| Apache | 0.0 /100 | #315 | Tragic 80.7% |
| Central American Indians | 0.0 /100 | #316 | Tragic 80.6% |
| Immigrants | Caribbean | 0.0 /100 | #317 | Tragic 80.5% |
| Yaqui | 0.0 /100 | #318 | Tragic 80.5% |
| Immigrants | Belize | 0.0 /100 | #319 | Tragic 80.5% |
| Immigrants | Cuba | 0.0 /100 | #320 | Tragic 80.2% |
| Yup'ik | 0.0 /100 | #321 | Tragic 80.0% |
| Lumbee | 0.0 /100 | #322 | Tragic 80.0% |
| Immigrants | Nicaragua | 0.0 /100 | #323 | Tragic 79.9% |
| Mexican American Indians | 0.0 /100 | #324 | Tragic 79.4% |
| Hondurans | 0.0 /100 | #325 | Tragic 79.3% |