Immigrants from Armenia vs Immigrants from Bosnia and Herzegovina GED/Equivalency
COMPARE
Immigrants from Armenia
Immigrants from Bosnia and Herzegovina
GED/Equivalency
GED/Equivalency Comparison
Immigrants from Armenia
Immigrants from Bosnia and Herzegovina
83.1%
GED/EQUIVALENCY
0.2/ 100
METRIC RATING
262nd/ 347
METRIC RANK
86.3%
GED/EQUIVALENCY
77.9/ 100
METRIC RATING
151st/ 347
METRIC RANK
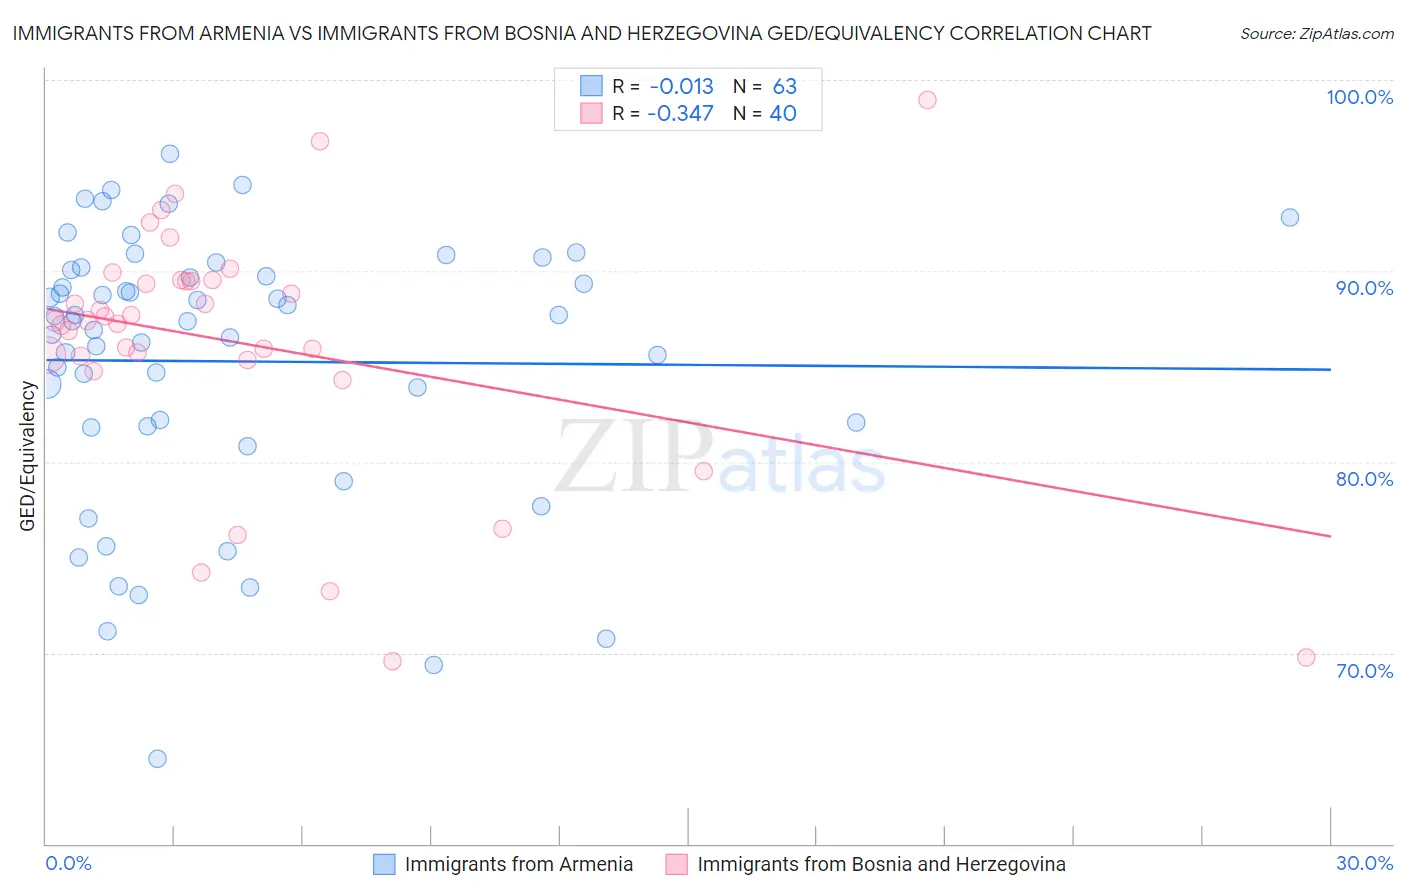
Immigrants from Armenia vs Immigrants from Bosnia and Herzegovina GED/Equivalency Correlation Chart
The statistical analysis conducted on geographies consisting of 97,725,183 people shows no correlation between the proportion of Immigrants from Armenia and percentage of population with at least ged/equivalency education in the United States with a correlation coefficient (R) of -0.013 and weighted average of 83.1%. Similarly, the statistical analysis conducted on geographies consisting of 156,819,615 people shows a mild negative correlation between the proportion of Immigrants from Bosnia and Herzegovina and percentage of population with at least ged/equivalency education in the United States with a correlation coefficient (R) of -0.347 and weighted average of 86.3%, a difference of 3.9%.
GED/Equivalency Correlation Summary
| Measurement | Immigrants from Armenia | Immigrants from Bosnia and Herzegovina |
| Minimum | 64.5% | 69.6% |
| Maximum | 96.1% | 98.9% |
| Range | 31.7% | 29.4% |
| Mean | 85.3% | 86.2% |
| Median | 87.4% | 87.4% |
| Interquartile 25% (IQ1) | 81.9% | 85.4% |
| Interquartile 75% (IQ3) | 90.1% | 89.5% |
| Interquartile Range (IQR) | 8.2% | 4.0% |
| Standard Deviation (Sample) | 7.1% | 6.5% |
| Standard Deviation (Population) | 7.0% | 6.5% |
Similar Demographics by GED/Equivalency
Demographics Similar to Immigrants from Armenia by GED/Equivalency
In terms of ged/equivalency, the demographic groups most similar to Immigrants from Armenia are Inupiat (83.1%, a difference of 0.0%), Immigrants from Congo (83.1%, a difference of 0.010%), Bangladeshi (83.1%, a difference of 0.020%), West Indian (83.1%, a difference of 0.030%), and Kiowa (83.1%, a difference of 0.040%).
| Demographics | Rating | Rank | GED/Equivalency |
| Colville | 0.5 /100 | #255 | Tragic 83.4% |
| Africans | 0.5 /100 | #256 | Tragic 83.4% |
| Jamaicans | 0.4 /100 | #257 | Tragic 83.3% |
| Malaysians | 0.4 /100 | #258 | Tragic 83.3% |
| Immigrants | Vietnam | 0.3 /100 | #259 | Tragic 83.2% |
| Choctaw | 0.3 /100 | #260 | Tragic 83.1% |
| Inupiat | 0.2 /100 | #261 | Tragic 83.1% |
| Immigrants | Armenia | 0.2 /100 | #262 | Tragic 83.1% |
| Immigrants | Congo | 0.2 /100 | #263 | Tragic 83.1% |
| Bangladeshis | 0.2 /100 | #264 | Tragic 83.1% |
| West Indians | 0.2 /100 | #265 | Tragic 83.1% |
| Kiowa | 0.2 /100 | #266 | Tragic 83.1% |
| Trinidadians and Tobagonians | 0.2 /100 | #267 | Tragic 83.0% |
| Immigrants | Burma/Myanmar | 0.2 /100 | #268 | Tragic 83.0% |
| Hopi | 0.2 /100 | #269 | Tragic 83.0% |
Demographics Similar to Immigrants from Bosnia and Herzegovina by GED/Equivalency
In terms of ged/equivalency, the demographic groups most similar to Immigrants from Bosnia and Herzegovina are Brazilian (86.3%, a difference of 0.020%), Immigrants from Western Asia (86.3%, a difference of 0.030%), Immigrants from Northern Africa (86.3%, a difference of 0.040%), Immigrants from Poland (86.3%, a difference of 0.040%), and Menominee (86.3%, a difference of 0.040%).
| Demographics | Rating | Rank | GED/Equivalency |
| Bolivians | 82.1 /100 | #144 | Excellent 86.4% |
| Pakistanis | 80.4 /100 | #145 | Excellent 86.4% |
| Basques | 79.5 /100 | #146 | Good 86.4% |
| Immigrants | Northern Africa | 79.3 /100 | #147 | Good 86.3% |
| Immigrants | Poland | 79.3 /100 | #148 | Good 86.3% |
| Menominee | 79.3 /100 | #149 | Good 86.3% |
| Immigrants | Western Asia | 78.8 /100 | #150 | Good 86.3% |
| Immigrants | Bosnia and Herzegovina | 77.9 /100 | #151 | Good 86.3% |
| Brazilians | 77.2 /100 | #152 | Good 86.3% |
| Kenyans | 76.6 /100 | #153 | Good 86.3% |
| Armenians | 76.4 /100 | #154 | Good 86.3% |
| Iraqis | 75.2 /100 | #155 | Good 86.2% |
| Immigrants | Nepal | 73.3 /100 | #156 | Good 86.2% |
| Whites/Caucasians | 72.2 /100 | #157 | Good 86.2% |
| German Russians | 72.1 /100 | #158 | Good 86.2% |