Immigrants from Armenia vs Spaniard GED/Equivalency
COMPARE
Immigrants from Armenia
Spaniard
GED/Equivalency
GED/Equivalency Comparison
Immigrants from Armenia
Spaniards
83.1%
GED/EQUIVALENCY
0.2/ 100
METRIC RATING
262nd/ 347
METRIC RANK
85.4%
GED/EQUIVALENCY
31.9/ 100
METRIC RATING
186th/ 347
METRIC RANK
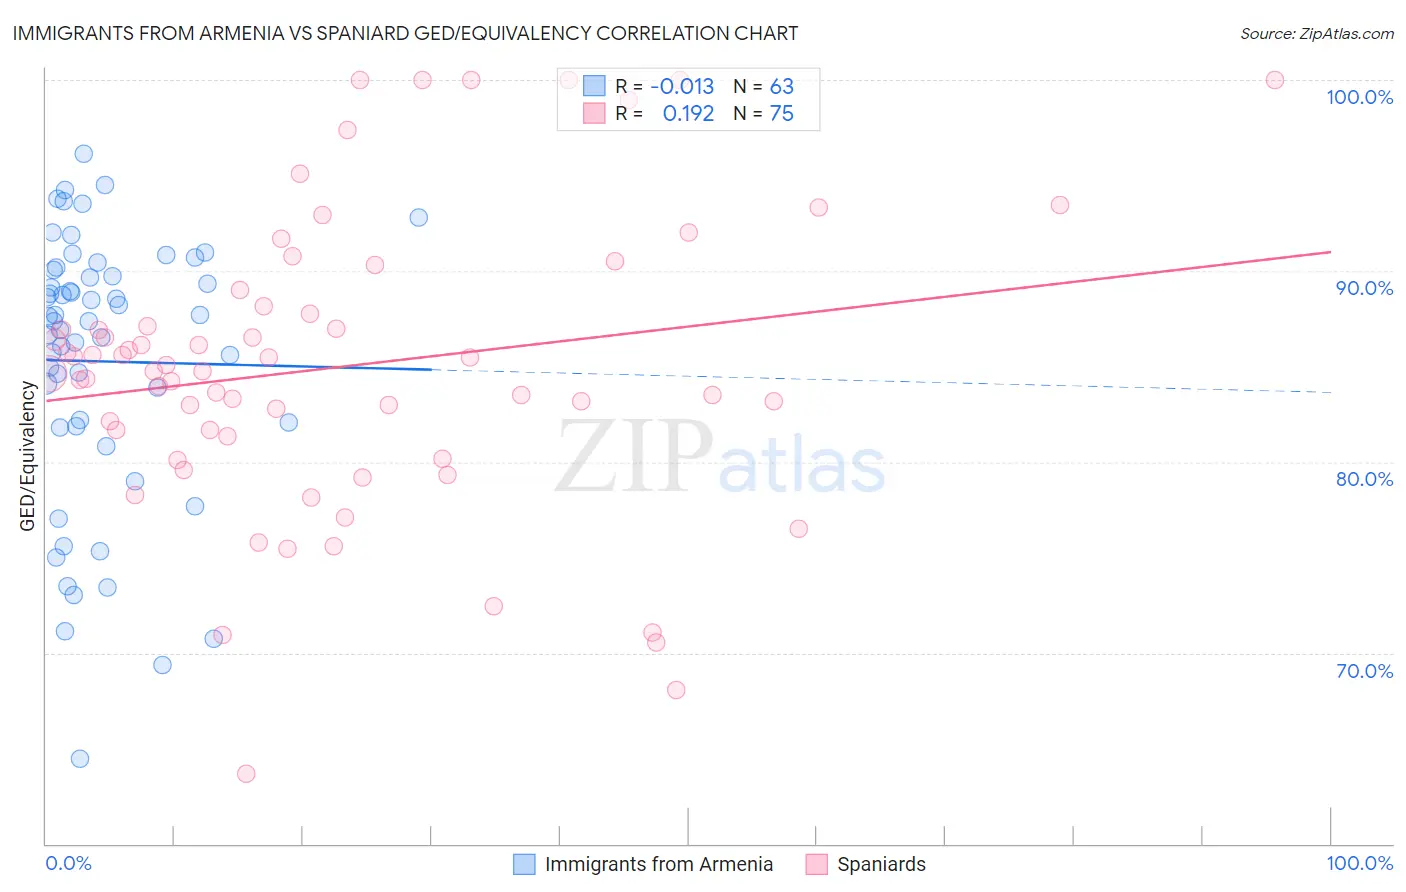
Immigrants from Armenia vs Spaniard GED/Equivalency Correlation Chart
The statistical analysis conducted on geographies consisting of 97,725,183 people shows no correlation between the proportion of Immigrants from Armenia and percentage of population with at least ged/equivalency education in the United States with a correlation coefficient (R) of -0.013 and weighted average of 83.1%. Similarly, the statistical analysis conducted on geographies consisting of 443,545,703 people shows a poor positive correlation between the proportion of Spaniards and percentage of population with at least ged/equivalency education in the United States with a correlation coefficient (R) of 0.192 and weighted average of 85.4%, a difference of 2.8%.
GED/Equivalency Correlation Summary
| Measurement | Immigrants from Armenia | Spaniard |
| Minimum | 64.5% | 63.6% |
| Maximum | 96.1% | 100.0% |
| Range | 31.7% | 36.4% |
| Mean | 85.3% | 85.0% |
| Median | 87.4% | 84.7% |
| Interquartile 25% (IQ1) | 81.9% | 81.4% |
| Interquartile 75% (IQ3) | 90.1% | 88.2% |
| Interquartile Range (IQR) | 8.2% | 6.8% |
| Standard Deviation (Sample) | 7.1% | 7.8% |
| Standard Deviation (Population) | 7.0% | 7.7% |
Similar Demographics by GED/Equivalency
Demographics Similar to Immigrants from Armenia by GED/Equivalency
In terms of ged/equivalency, the demographic groups most similar to Immigrants from Armenia are Inupiat (83.1%, a difference of 0.0%), Immigrants from Congo (83.1%, a difference of 0.010%), Bangladeshi (83.1%, a difference of 0.020%), West Indian (83.1%, a difference of 0.030%), and Kiowa (83.1%, a difference of 0.040%).
| Demographics | Rating | Rank | GED/Equivalency |
| Colville | 0.5 /100 | #255 | Tragic 83.4% |
| Africans | 0.5 /100 | #256 | Tragic 83.4% |
| Jamaicans | 0.4 /100 | #257 | Tragic 83.3% |
| Malaysians | 0.4 /100 | #258 | Tragic 83.3% |
| Immigrants | Vietnam | 0.3 /100 | #259 | Tragic 83.2% |
| Choctaw | 0.3 /100 | #260 | Tragic 83.1% |
| Inupiat | 0.2 /100 | #261 | Tragic 83.1% |
| Immigrants | Armenia | 0.2 /100 | #262 | Tragic 83.1% |
| Immigrants | Congo | 0.2 /100 | #263 | Tragic 83.1% |
| Bangladeshis | 0.2 /100 | #264 | Tragic 83.1% |
| West Indians | 0.2 /100 | #265 | Tragic 83.1% |
| Kiowa | 0.2 /100 | #266 | Tragic 83.1% |
| Trinidadians and Tobagonians | 0.2 /100 | #267 | Tragic 83.0% |
| Immigrants | Burma/Myanmar | 0.2 /100 | #268 | Tragic 83.0% |
| Hopi | 0.2 /100 | #269 | Tragic 83.0% |
Demographics Similar to Spaniards by GED/Equivalency
In terms of ged/equivalency, the demographic groups most similar to Spaniards are Spanish (85.4%, a difference of 0.020%), Immigrants from Oceania (85.5%, a difference of 0.040%), Immigrants from Sudan (85.5%, a difference of 0.050%), Immigrants from Afghanistan (85.4%, a difference of 0.050%), and Sudanese (85.5%, a difference of 0.070%).
| Demographics | Rating | Rank | GED/Equivalency |
| Aleuts | 40.5 /100 | #179 | Average 85.6% |
| Immigrants | Southern Europe | 38.4 /100 | #180 | Fair 85.5% |
| Moroccans | 37.7 /100 | #181 | Fair 85.5% |
| Sudanese | 35.2 /100 | #182 | Fair 85.5% |
| Immigrants | Sudan | 34.2 /100 | #183 | Fair 85.5% |
| Immigrants | Oceania | 33.6 /100 | #184 | Fair 85.5% |
| Spanish | 32.8 /100 | #185 | Fair 85.4% |
| Spaniards | 31.9 /100 | #186 | Fair 85.4% |
| Immigrants | Afghanistan | 29.8 /100 | #187 | Fair 85.4% |
| Immigrants | Sierra Leone | 29.0 /100 | #188 | Fair 85.4% |
| Guamanians/Chamorros | 28.4 /100 | #189 | Fair 85.3% |
| Alaskan Athabascans | 27.5 /100 | #190 | Fair 85.3% |
| South American Indians | 22.8 /100 | #191 | Fair 85.2% |
| Immigrants | Nonimmigrants | 22.7 /100 | #192 | Fair 85.2% |
| Delaware | 22.2 /100 | #193 | Fair 85.2% |