Immigrants from Armenia vs Immigrants from Ghana GED/Equivalency
COMPARE
Immigrants from Armenia
Immigrants from Ghana
GED/Equivalency
GED/Equivalency Comparison
Immigrants from Armenia
Immigrants from Ghana
83.1%
GED/EQUIVALENCY
0.2/ 100
METRIC RATING
262nd/ 347
METRIC RANK
83.9%
GED/EQUIVALENCY
1.3/ 100
METRIC RATING
244th/ 347
METRIC RANK
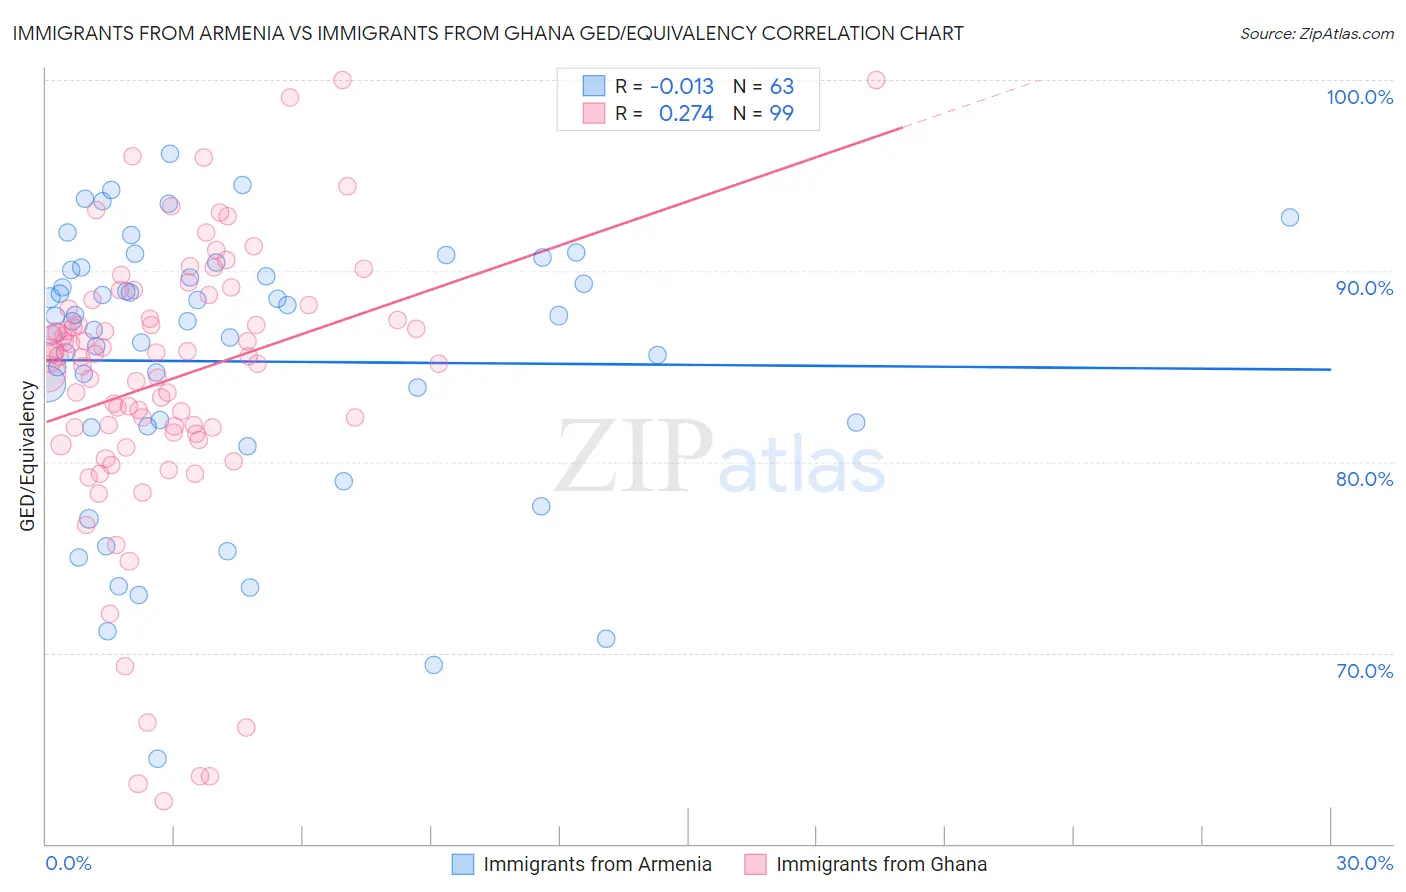
Immigrants from Armenia vs Immigrants from Ghana GED/Equivalency Correlation Chart
The statistical analysis conducted on geographies consisting of 97,725,183 people shows no correlation between the proportion of Immigrants from Armenia and percentage of population with at least ged/equivalency education in the United States with a correlation coefficient (R) of -0.013 and weighted average of 83.1%. Similarly, the statistical analysis conducted on geographies consisting of 199,951,982 people shows a weak positive correlation between the proportion of Immigrants from Ghana and percentage of population with at least ged/equivalency education in the United States with a correlation coefficient (R) of 0.274 and weighted average of 83.9%, a difference of 0.93%.
GED/Equivalency Correlation Summary
| Measurement | Immigrants from Armenia | Immigrants from Ghana |
| Minimum | 64.5% | 62.2% |
| Maximum | 96.1% | 100.0% |
| Range | 31.7% | 37.8% |
| Mean | 85.3% | 84.3% |
| Median | 87.4% | 85.5% |
| Interquartile 25% (IQ1) | 81.9% | 81.6% |
| Interquartile 75% (IQ3) | 90.1% | 88.2% |
| Interquartile Range (IQR) | 8.2% | 6.7% |
| Standard Deviation (Sample) | 7.1% | 7.4% |
| Standard Deviation (Population) | 7.0% | 7.4% |
Demographics Similar to Immigrants from Armenia and Immigrants from Ghana by GED/Equivalency
In terms of ged/equivalency, the demographic groups most similar to Immigrants from Armenia are Inupiat (83.1%, a difference of 0.0%), Immigrants from Congo (83.1%, a difference of 0.010%), Choctaw (83.1%, a difference of 0.060%), Immigrants from Vietnam (83.2%, a difference of 0.090%), and Malaysian (83.3%, a difference of 0.23%). Similarly, the demographic groups most similar to Immigrants from Ghana are Cherokee (83.9%, a difference of 0.010%), Immigrants from Senegal (83.8%, a difference of 0.030%), Chickasaw (83.8%, a difference of 0.050%), Immigrants from Western Africa (83.8%, a difference of 0.090%), and Blackfeet (83.8%, a difference of 0.10%).
| Demographics | Rating | Rank | GED/Equivalency |
| Cherokee | 1.3 /100 | #243 | Tragic 83.9% |
| Immigrants | Ghana | 1.3 /100 | #244 | Tragic 83.9% |
| Immigrants | Senegal | 1.2 /100 | #245 | Tragic 83.8% |
| Chickasaw | 1.2 /100 | #246 | Tragic 83.8% |
| Immigrants | Western Africa | 1.1 /100 | #247 | Tragic 83.8% |
| Blackfeet | 1.1 /100 | #248 | Tragic 83.8% |
| Crow | 1.1 /100 | #249 | Tragic 83.8% |
| Shoshone | 1.0 /100 | #250 | Tragic 83.7% |
| Spanish Americans | 0.8 /100 | #251 | Tragic 83.6% |
| Bahamians | 0.8 /100 | #252 | Tragic 83.6% |
| Comanche | 0.7 /100 | #253 | Tragic 83.6% |
| Creek | 0.7 /100 | #254 | Tragic 83.6% |
| Colville | 0.5 /100 | #255 | Tragic 83.4% |
| Africans | 0.5 /100 | #256 | Tragic 83.4% |
| Jamaicans | 0.4 /100 | #257 | Tragic 83.3% |
| Malaysians | 0.4 /100 | #258 | Tragic 83.3% |
| Immigrants | Vietnam | 0.3 /100 | #259 | Tragic 83.2% |
| Choctaw | 0.3 /100 | #260 | Tragic 83.1% |
| Inupiat | 0.2 /100 | #261 | Tragic 83.1% |
| Immigrants | Armenia | 0.2 /100 | #262 | Tragic 83.1% |
| Immigrants | Congo | 0.2 /100 | #263 | Tragic 83.1% |