Immigrants from Armenia vs Immigrants from Ethiopia GED/Equivalency
COMPARE
Immigrants from Armenia
Immigrants from Ethiopia
GED/Equivalency
GED/Equivalency Comparison
Immigrants from Armenia
Immigrants from Ethiopia
83.1%
GED/EQUIVALENCY
0.2/ 100
METRIC RATING
262nd/ 347
METRIC RANK
86.0%
GED/EQUIVALENCY
61.2/ 100
METRIC RATING
169th/ 347
METRIC RANK
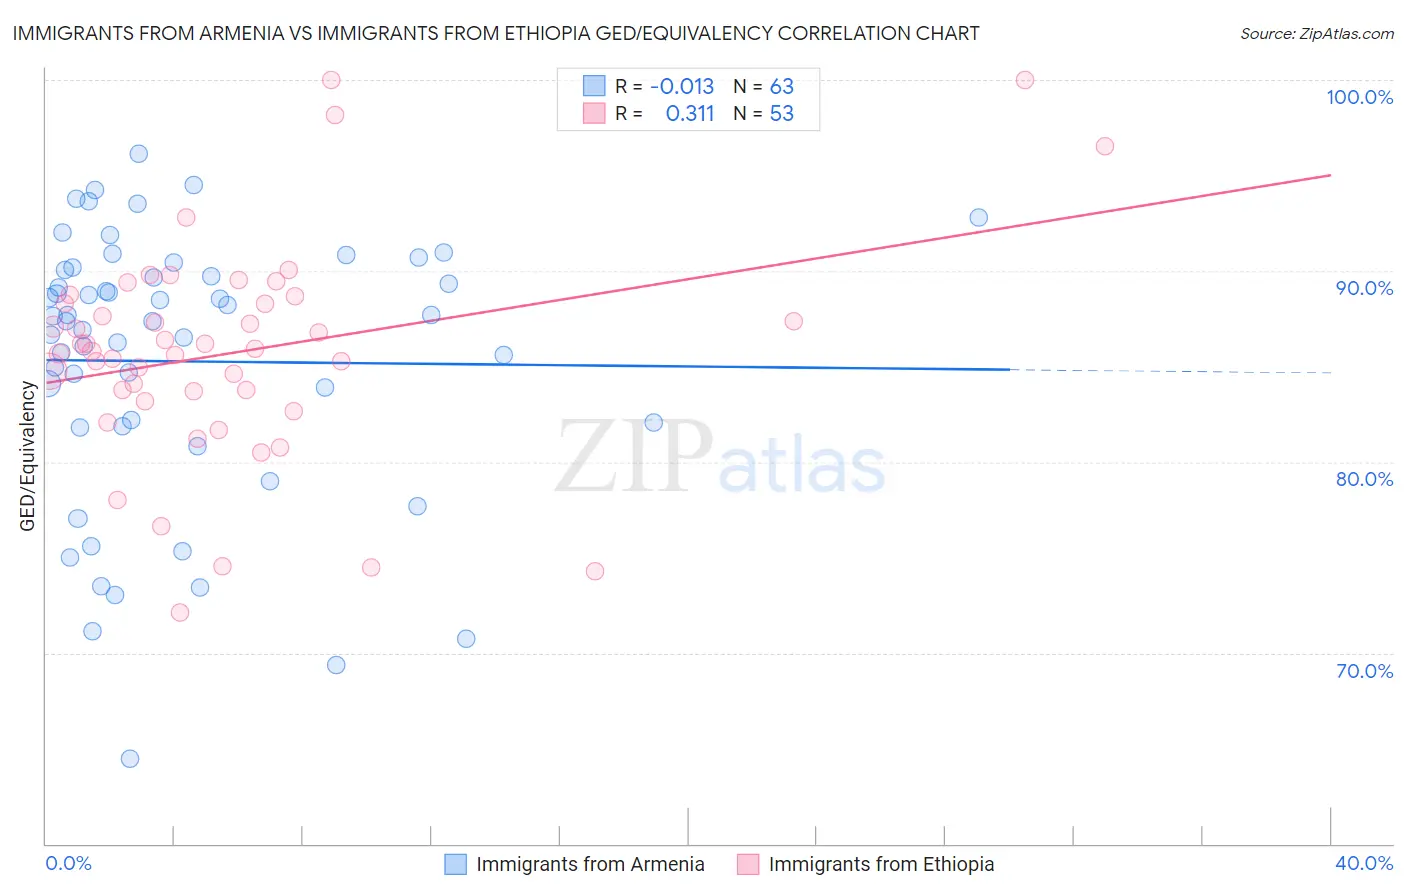
Immigrants from Armenia vs Immigrants from Ethiopia GED/Equivalency Correlation Chart
The statistical analysis conducted on geographies consisting of 97,725,183 people shows no correlation between the proportion of Immigrants from Armenia and percentage of population with at least ged/equivalency education in the United States with a correlation coefficient (R) of -0.013 and weighted average of 83.1%. Similarly, the statistical analysis conducted on geographies consisting of 211,528,629 people shows a mild positive correlation between the proportion of Immigrants from Ethiopia and percentage of population with at least ged/equivalency education in the United States with a correlation coefficient (R) of 0.311 and weighted average of 86.0%, a difference of 3.5%.
GED/Equivalency Correlation Summary
| Measurement | Immigrants from Armenia | Immigrants from Ethiopia |
| Minimum | 64.5% | 72.1% |
| Maximum | 96.1% | 100.0% |
| Range | 31.7% | 27.9% |
| Mean | 85.3% | 85.8% |
| Median | 87.4% | 85.9% |
| Interquartile 25% (IQ1) | 81.9% | 83.4% |
| Interquartile 75% (IQ3) | 90.1% | 88.5% |
| Interquartile Range (IQR) | 8.2% | 5.0% |
| Standard Deviation (Sample) | 7.1% | 5.7% |
| Standard Deviation (Population) | 7.0% | 5.7% |
Similar Demographics by GED/Equivalency
Demographics Similar to Immigrants from Armenia by GED/Equivalency
In terms of ged/equivalency, the demographic groups most similar to Immigrants from Armenia are Inupiat (83.1%, a difference of 0.0%), Immigrants from Congo (83.1%, a difference of 0.010%), Bangladeshi (83.1%, a difference of 0.020%), West Indian (83.1%, a difference of 0.030%), and Kiowa (83.1%, a difference of 0.040%).
| Demographics | Rating | Rank | GED/Equivalency |
| Colville | 0.5 /100 | #255 | Tragic 83.4% |
| Africans | 0.5 /100 | #256 | Tragic 83.4% |
| Jamaicans | 0.4 /100 | #257 | Tragic 83.3% |
| Malaysians | 0.4 /100 | #258 | Tragic 83.3% |
| Immigrants | Vietnam | 0.3 /100 | #259 | Tragic 83.2% |
| Choctaw | 0.3 /100 | #260 | Tragic 83.1% |
| Inupiat | 0.2 /100 | #261 | Tragic 83.1% |
| Immigrants | Armenia | 0.2 /100 | #262 | Tragic 83.1% |
| Immigrants | Congo | 0.2 /100 | #263 | Tragic 83.1% |
| Bangladeshis | 0.2 /100 | #264 | Tragic 83.1% |
| West Indians | 0.2 /100 | #265 | Tragic 83.1% |
| Kiowa | 0.2 /100 | #266 | Tragic 83.1% |
| Trinidadians and Tobagonians | 0.2 /100 | #267 | Tragic 83.0% |
| Immigrants | Burma/Myanmar | 0.2 /100 | #268 | Tragic 83.0% |
| Hopi | 0.2 /100 | #269 | Tragic 83.0% |
Demographics Similar to Immigrants from Ethiopia by GED/Equivalency
In terms of ged/equivalency, the demographic groups most similar to Immigrants from Ethiopia are Sierra Leonean (86.0%, a difference of 0.010%), Afghan (85.9%, a difference of 0.030%), Ethiopian (86.0%, a difference of 0.050%), Alsatian (86.0%, a difference of 0.070%), and Immigrants from Albania (86.0%, a difference of 0.070%).
| Demographics | Rating | Rank | GED/Equivalency |
| Immigrants | Iraq | 68.1 /100 | #162 | Good 86.1% |
| Ugandans | 66.3 /100 | #163 | Good 86.1% |
| Venezuelans | 65.5 /100 | #164 | Good 86.0% |
| Alsatians | 64.3 /100 | #165 | Good 86.0% |
| Immigrants | Albania | 64.2 /100 | #166 | Good 86.0% |
| Ethiopians | 63.7 /100 | #167 | Good 86.0% |
| Sierra Leoneans | 61.8 /100 | #168 | Good 86.0% |
| Immigrants | Ethiopia | 61.2 /100 | #169 | Good 86.0% |
| Afghans | 59.7 /100 | #170 | Average 85.9% |
| Immigrants | Chile | 57.3 /100 | #171 | Average 85.9% |
| Bermudans | 55.1 /100 | #172 | Average 85.8% |
| Immigrants | Venezuela | 50.7 /100 | #173 | Average 85.8% |
| Ottawa | 50.0 /100 | #174 | Average 85.8% |
| Immigrants | Bolivia | 49.8 /100 | #175 | Average 85.8% |
| Immigrants | Eastern Africa | 47.7 /100 | #176 | Average 85.7% |