Mongolian vs Greek GED/Equivalency
COMPARE
Mongolian
Greek
GED/Equivalency
GED/Equivalency Comparison
Mongolians
Greeks
87.0%
GED/EQUIVALENCY
94.6/ 100
METRIC RATING
115th/ 347
METRIC RANK
88.1%
GED/EQUIVALENCY
99.5/ 100
METRIC RATING
48th/ 347
METRIC RANK
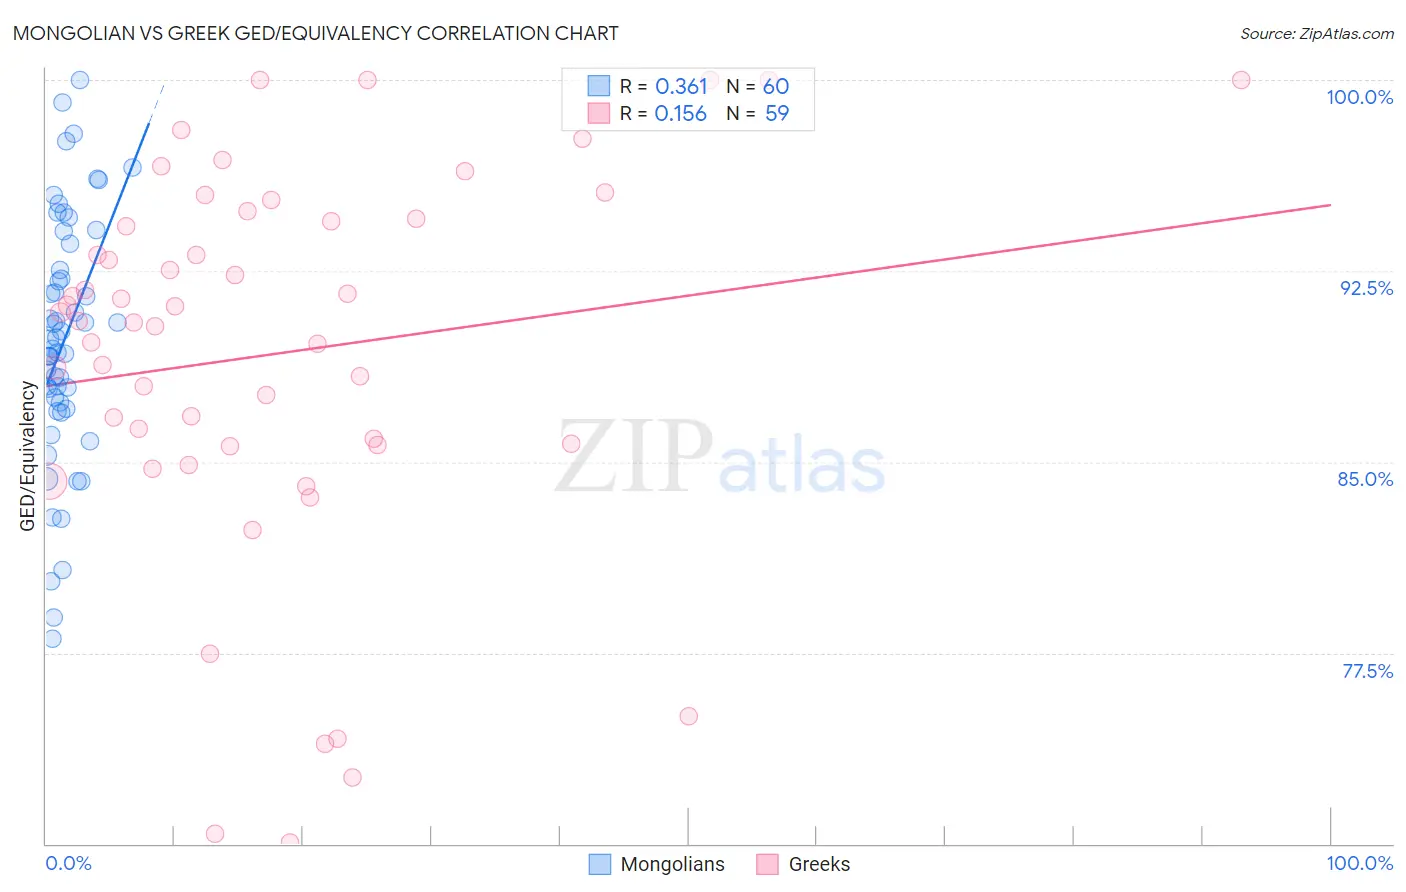
Mongolian vs Greek GED/Equivalency Correlation Chart
The statistical analysis conducted on geographies consisting of 140,361,663 people shows a mild positive correlation between the proportion of Mongolians and percentage of population with at least ged/equivalency education in the United States with a correlation coefficient (R) of 0.361 and weighted average of 87.0%. Similarly, the statistical analysis conducted on geographies consisting of 482,775,362 people shows a poor positive correlation between the proportion of Greeks and percentage of population with at least ged/equivalency education in the United States with a correlation coefficient (R) of 0.156 and weighted average of 88.1%, a difference of 1.2%.
GED/Equivalency Correlation Summary
| Measurement | Mongolian | Greek |
| Minimum | 78.1% | 70.0% |
| Maximum | 100.0% | 100.0% |
| Range | 21.9% | 30.0% |
| Mean | 89.8% | 89.2% |
| Median | 89.6% | 90.5% |
| Interquartile 25% (IQ1) | 87.2% | 85.7% |
| Interquartile 75% (IQ3) | 93.1% | 94.6% |
| Interquartile Range (IQR) | 5.8% | 8.9% |
| Standard Deviation (Sample) | 4.8% | 7.5% |
| Standard Deviation (Population) | 4.8% | 7.4% |
Similar Demographics by GED/Equivalency
Demographics Similar to Mongolians by GED/Equivalency
In terms of ged/equivalency, the demographic groups most similar to Mongolians are Immigrants from Kazakhstan (87.0%, a difference of 0.010%), Swiss (87.0%, a difference of 0.010%), Tlingit-Haida (87.0%, a difference of 0.020%), Assyrian/Chaldean/Syriac (87.0%, a difference of 0.020%), and French (87.1%, a difference of 0.060%).
| Demographics | Rating | Rank | GED/Equivalency |
| Canadians | 95.6 /100 | #108 | Exceptional 87.1% |
| Immigrants | Eastern Europe | 95.5 /100 | #109 | Exceptional 87.1% |
| Egyptians | 95.3 /100 | #110 | Exceptional 87.1% |
| French | 95.2 /100 | #111 | Exceptional 87.1% |
| Tlingit-Haida | 94.8 /100 | #112 | Exceptional 87.0% |
| Assyrians/Chaldeans/Syriacs | 94.8 /100 | #113 | Exceptional 87.0% |
| Immigrants | Kazakhstan | 94.7 /100 | #114 | Exceptional 87.0% |
| Mongolians | 94.6 /100 | #115 | Exceptional 87.0% |
| Swiss | 94.5 /100 | #116 | Exceptional 87.0% |
| Immigrants | Hong Kong | 93.8 /100 | #117 | Exceptional 86.9% |
| French Canadians | 93.2 /100 | #118 | Exceptional 86.9% |
| Immigrants | China | 93.2 /100 | #119 | Exceptional 86.9% |
| Scotch-Irish | 91.6 /100 | #120 | Exceptional 86.8% |
| Immigrants | Lebanon | 90.9 /100 | #121 | Exceptional 86.8% |
| Immigrants | Jordan | 90.8 /100 | #122 | Exceptional 86.8% |
Demographics Similar to Greeks by GED/Equivalency
In terms of ged/equivalency, the demographic groups most similar to Greeks are Immigrants from Latvia (88.1%, a difference of 0.010%), Australian (88.1%, a difference of 0.010%), Immigrants from Switzerland (88.1%, a difference of 0.020%), Immigrants from Korea (88.1%, a difference of 0.020%), and Czech (88.1%, a difference of 0.030%).
| Demographics | Rating | Rank | GED/Equivalency |
| Finns | 99.6 /100 | #41 | Exceptional 88.2% |
| Cambodians | 99.6 /100 | #42 | Exceptional 88.2% |
| Immigrants | Scotland | 99.6 /100 | #43 | Exceptional 88.2% |
| Macedonians | 99.5 /100 | #44 | Exceptional 88.1% |
| Czechs | 99.5 /100 | #45 | Exceptional 88.1% |
| Immigrants | Switzerland | 99.5 /100 | #46 | Exceptional 88.1% |
| Immigrants | Latvia | 99.5 /100 | #47 | Exceptional 88.1% |
| Greeks | 99.5 /100 | #48 | Exceptional 88.1% |
| Australians | 99.5 /100 | #49 | Exceptional 88.1% |
| Immigrants | Korea | 99.5 /100 | #50 | Exceptional 88.1% |
| Immigrants | Netherlands | 99.4 /100 | #51 | Exceptional 88.0% |
| Zimbabweans | 99.4 /100 | #52 | Exceptional 88.0% |
| Immigrants | South Africa | 99.4 /100 | #53 | Exceptional 88.0% |
| Soviet Union | 99.4 /100 | #54 | Exceptional 88.0% |
| New Zealanders | 99.4 /100 | #55 | Exceptional 88.0% |