Immigrants from Western Europe vs Greek GED/Equivalency
COMPARE
Immigrants from Western Europe
Greek
GED/Equivalency
GED/Equivalency Comparison
Immigrants from Western Europe
Greeks
87.3%
GED/EQUIVALENCY
97.3/ 100
METRIC RATING
97th/ 347
METRIC RANK
88.1%
GED/EQUIVALENCY
99.5/ 100
METRIC RATING
48th/ 347
METRIC RANK
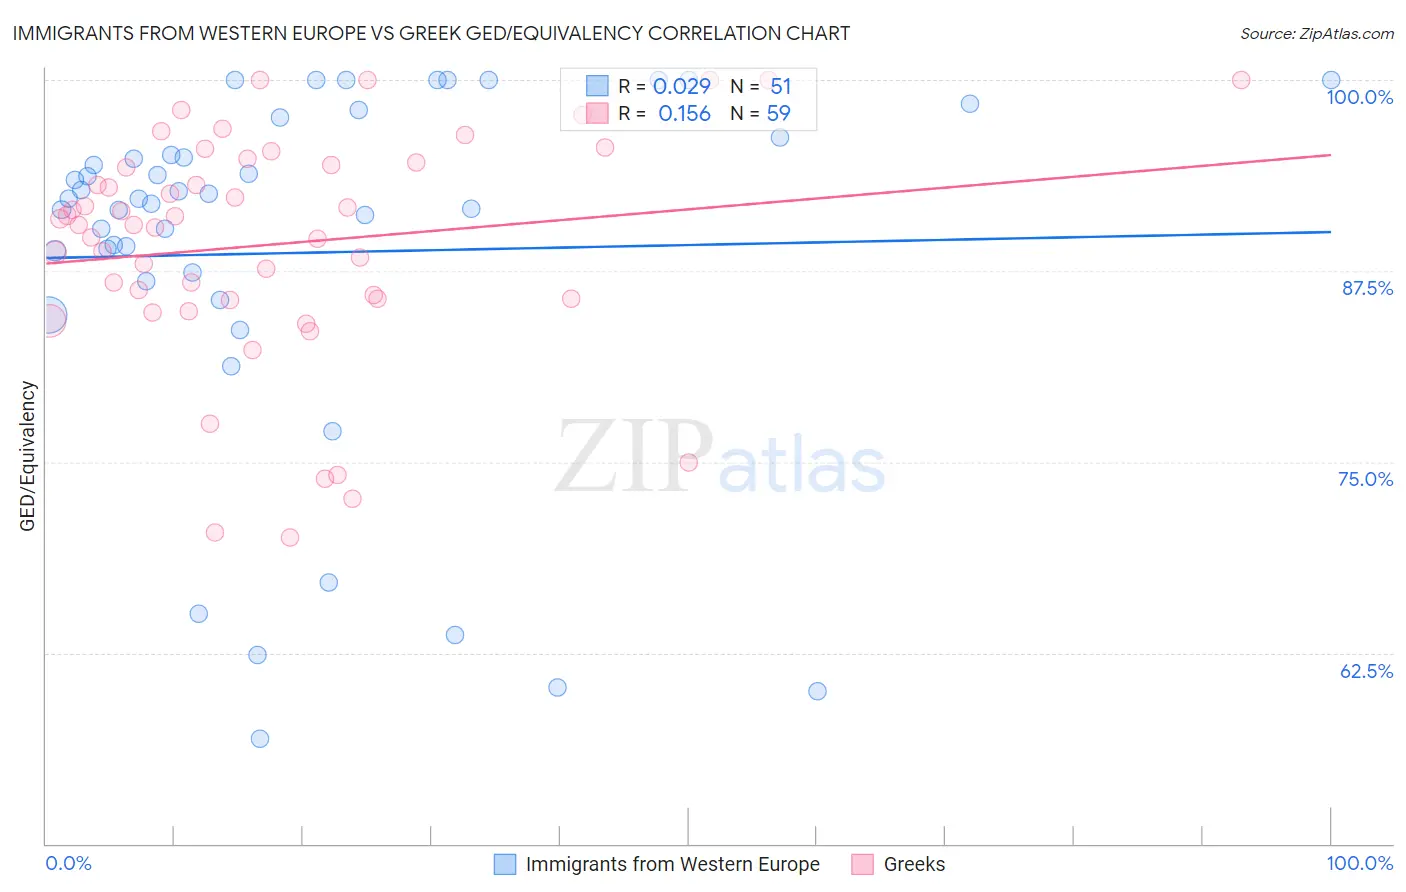
Immigrants from Western Europe vs Greek GED/Equivalency Correlation Chart
The statistical analysis conducted on geographies consisting of 494,080,521 people shows no correlation between the proportion of Immigrants from Western Europe and percentage of population with at least ged/equivalency education in the United States with a correlation coefficient (R) of 0.029 and weighted average of 87.3%. Similarly, the statistical analysis conducted on geographies consisting of 482,775,362 people shows a poor positive correlation between the proportion of Greeks and percentage of population with at least ged/equivalency education in the United States with a correlation coefficient (R) of 0.156 and weighted average of 88.1%, a difference of 0.84%.
GED/Equivalency Correlation Summary
| Measurement | Immigrants from Western Europe | Greek |
| Minimum | 56.9% | 70.0% |
| Maximum | 100.0% | 100.0% |
| Range | 43.1% | 30.0% |
| Mean | 88.7% | 89.2% |
| Median | 92.2% | 90.5% |
| Interquartile 25% (IQ1) | 86.8% | 85.7% |
| Interquartile 75% (IQ3) | 96.2% | 94.6% |
| Interquartile Range (IQR) | 9.4% | 8.9% |
| Standard Deviation (Sample) | 11.9% | 7.5% |
| Standard Deviation (Population) | 11.8% | 7.4% |
Similar Demographics by GED/Equivalency
Demographics Similar to Immigrants from Western Europe by GED/Equivalency
In terms of ged/equivalency, the demographic groups most similar to Immigrants from Western Europe are Czechoslovakian (87.4%, a difference of 0.070%), Immigrants from Croatia (87.3%, a difference of 0.070%), Immigrants from Belarus (87.3%, a difference of 0.070%), Immigrants from Greece (87.4%, a difference of 0.090%), and Palestinian (87.3%, a difference of 0.090%).
| Demographics | Rating | Rank | GED/Equivalency |
| Welsh | 97.9 /100 | #90 | Exceptional 87.4% |
| Immigrants | Eastern Asia | 97.9 /100 | #91 | Exceptional 87.4% |
| Israelis | 97.8 /100 | #92 | Exceptional 87.4% |
| Immigrants | North Macedonia | 97.8 /100 | #93 | Exceptional 87.4% |
| Immigrants | Russia | 97.8 /100 | #94 | Exceptional 87.4% |
| Immigrants | Greece | 97.7 /100 | #95 | Exceptional 87.4% |
| Czechoslovakians | 97.6 /100 | #96 | Exceptional 87.4% |
| Immigrants | Western Europe | 97.3 /100 | #97 | Exceptional 87.3% |
| Immigrants | Croatia | 96.9 /100 | #98 | Exceptional 87.3% |
| Immigrants | Belarus | 96.9 /100 | #99 | Exceptional 87.3% |
| Palestinians | 96.8 /100 | #100 | Exceptional 87.3% |
| Syrians | 96.6 /100 | #101 | Exceptional 87.2% |
| Lebanese | 96.2 /100 | #102 | Exceptional 87.2% |
| Jordanians | 96.1 /100 | #103 | Exceptional 87.2% |
| Immigrants | Hungary | 96.0 /100 | #104 | Exceptional 87.2% |
Demographics Similar to Greeks by GED/Equivalency
In terms of ged/equivalency, the demographic groups most similar to Greeks are Immigrants from Latvia (88.1%, a difference of 0.010%), Australian (88.1%, a difference of 0.010%), Immigrants from Switzerland (88.1%, a difference of 0.020%), Immigrants from Korea (88.1%, a difference of 0.020%), and Czech (88.1%, a difference of 0.030%).
| Demographics | Rating | Rank | GED/Equivalency |
| Finns | 99.6 /100 | #41 | Exceptional 88.2% |
| Cambodians | 99.6 /100 | #42 | Exceptional 88.2% |
| Immigrants | Scotland | 99.6 /100 | #43 | Exceptional 88.2% |
| Macedonians | 99.5 /100 | #44 | Exceptional 88.1% |
| Czechs | 99.5 /100 | #45 | Exceptional 88.1% |
| Immigrants | Switzerland | 99.5 /100 | #46 | Exceptional 88.1% |
| Immigrants | Latvia | 99.5 /100 | #47 | Exceptional 88.1% |
| Greeks | 99.5 /100 | #48 | Exceptional 88.1% |
| Australians | 99.5 /100 | #49 | Exceptional 88.1% |
| Immigrants | Korea | 99.5 /100 | #50 | Exceptional 88.1% |
| Immigrants | Netherlands | 99.4 /100 | #51 | Exceptional 88.0% |
| Zimbabweans | 99.4 /100 | #52 | Exceptional 88.0% |
| Immigrants | South Africa | 99.4 /100 | #53 | Exceptional 88.0% |
| Soviet Union | 99.4 /100 | #54 | Exceptional 88.0% |
| New Zealanders | 99.4 /100 | #55 | Exceptional 88.0% |