Hungarian vs Lumbee Master's Degree
COMPARE
Hungarian
Lumbee
Master's Degree
Master's Degree Comparison
Hungarians
Lumbee
15.6%
MASTER'S DEGREE
79.1/ 100
METRIC RATING
147th/ 347
METRIC RANK
9.3%
MASTER'S DEGREE
0.0/ 100
METRIC RATING
343rd/ 347
METRIC RANK
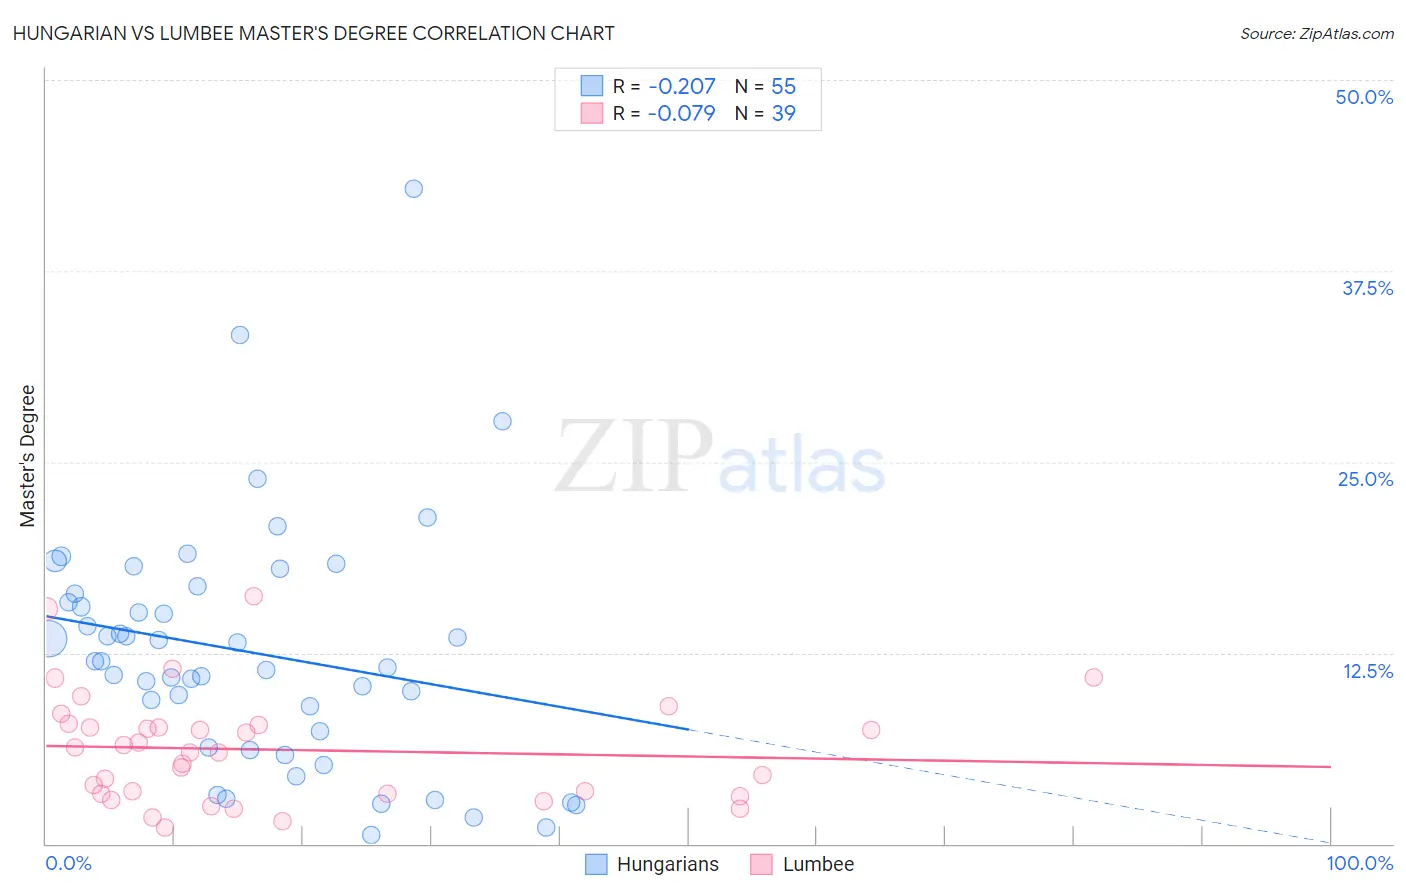
Hungarian vs Lumbee Master's Degree Correlation Chart
The statistical analysis conducted on geographies consisting of 485,986,149 people shows a weak negative correlation between the proportion of Hungarians and percentage of population with at least master's degree education in the United States with a correlation coefficient (R) of -0.207 and weighted average of 15.6%. Similarly, the statistical analysis conducted on geographies consisting of 92,286,127 people shows a slight negative correlation between the proportion of Lumbee and percentage of population with at least master's degree education in the United States with a correlation coefficient (R) of -0.079 and weighted average of 9.3%, a difference of 67.9%.
Master's Degree Correlation Summary
| Measurement | Hungarian | Lumbee |
| Minimum | 0.58% | 1.0% |
| Maximum | 42.9% | 16.2% |
| Range | 42.3% | 15.2% |
| Mean | 12.5% | 6.2% |
| Median | 11.9% | 6.0% |
| Interquartile 25% (IQ1) | 6.3% | 3.3% |
| Interquartile 75% (IQ3) | 16.4% | 7.8% |
| Interquartile Range (IQR) | 10.1% | 4.5% |
| Standard Deviation (Sample) | 8.0% | 3.6% |
| Standard Deviation (Population) | 7.9% | 3.5% |
Similar Demographics by Master's Degree
Demographics Similar to Hungarians by Master's Degree
In terms of master's degree, the demographic groups most similar to Hungarians are Immigrants from Afghanistan (15.6%, a difference of 0.040%), Immigrants from Senegal (15.5%, a difference of 0.17%), Ghanaian (15.5%, a difference of 0.18%), Slovene (15.5%, a difference of 0.21%), and Iraqi (15.5%, a difference of 0.33%).
| Demographics | Rating | Rank | Master's Degree |
| Vietnamese | 85.5 /100 | #140 | Excellent 15.8% |
| Poles | 85.0 /100 | #141 | Excellent 15.7% |
| Immigrants | Africa | 84.0 /100 | #142 | Excellent 15.7% |
| Immigrants | Venezuela | 83.6 /100 | #143 | Excellent 15.7% |
| Canadians | 83.3 /100 | #144 | Excellent 15.7% |
| South Americans | 81.3 /100 | #145 | Excellent 15.6% |
| Immigrants | Afghanistan | 79.4 /100 | #146 | Good 15.6% |
| Hungarians | 79.1 /100 | #147 | Good 15.6% |
| Immigrants | Senegal | 78.2 /100 | #148 | Good 15.5% |
| Ghanaians | 78.2 /100 | #149 | Good 15.5% |
| Slovenes | 78.0 /100 | #150 | Good 15.5% |
| Iraqis | 77.3 /100 | #151 | Good 15.5% |
| Slavs | 77.0 /100 | #152 | Good 15.5% |
| Icelanders | 76.8 /100 | #153 | Good 15.5% |
| Immigrants | South America | 76.3 /100 | #154 | Good 15.5% |
Demographics Similar to Lumbee by Master's Degree
In terms of master's degree, the demographic groups most similar to Lumbee are Pima (9.2%, a difference of 0.17%), Yuman (9.2%, a difference of 0.32%), Immigrants from Mexico (9.3%, a difference of 0.48%), Navajo (9.4%, a difference of 1.8%), and Yakama (9.5%, a difference of 2.1%).
| Demographics | Rating | Rank | Master's Degree |
| Menominee | 0.0 /100 | #333 | Tragic 10.2% |
| Arapaho | 0.0 /100 | #334 | Tragic 10.0% |
| Immigrants | Central America | 0.0 /100 | #335 | Tragic 10.0% |
| Natives/Alaskans | 0.0 /100 | #336 | Tragic 9.9% |
| Mexicans | 0.0 /100 | #337 | Tragic 9.7% |
| Tohono O'odham | 0.0 /100 | #338 | Tragic 9.7% |
| Spanish American Indians | 0.0 /100 | #339 | Tragic 9.6% |
| Yakama | 0.0 /100 | #340 | Tragic 9.5% |
| Navajo | 0.0 /100 | #341 | Tragic 9.4% |
| Immigrants | Mexico | 0.0 /100 | #342 | Tragic 9.3% |
| Lumbee | 0.0 /100 | #343 | Tragic 9.3% |
| Pima | 0.0 /100 | #344 | Tragic 9.2% |
| Yuman | 0.0 /100 | #345 | Tragic 9.2% |
| Yup'ik | 0.0 /100 | #346 | Tragic 8.5% |
| Houma | 0.0 /100 | #347 | Tragic 7.9% |