Hungarian vs Immigrants from Uganda Master's Degree
COMPARE
Hungarian
Immigrants from Uganda
Master's Degree
Master's Degree Comparison
Hungarians
Immigrants from Uganda
15.6%
MASTER'S DEGREE
79.1/ 100
METRIC RATING
147th/ 347
METRIC RANK
16.6%
MASTER'S DEGREE
97.3/ 100
METRIC RATING
115th/ 347
METRIC RANK
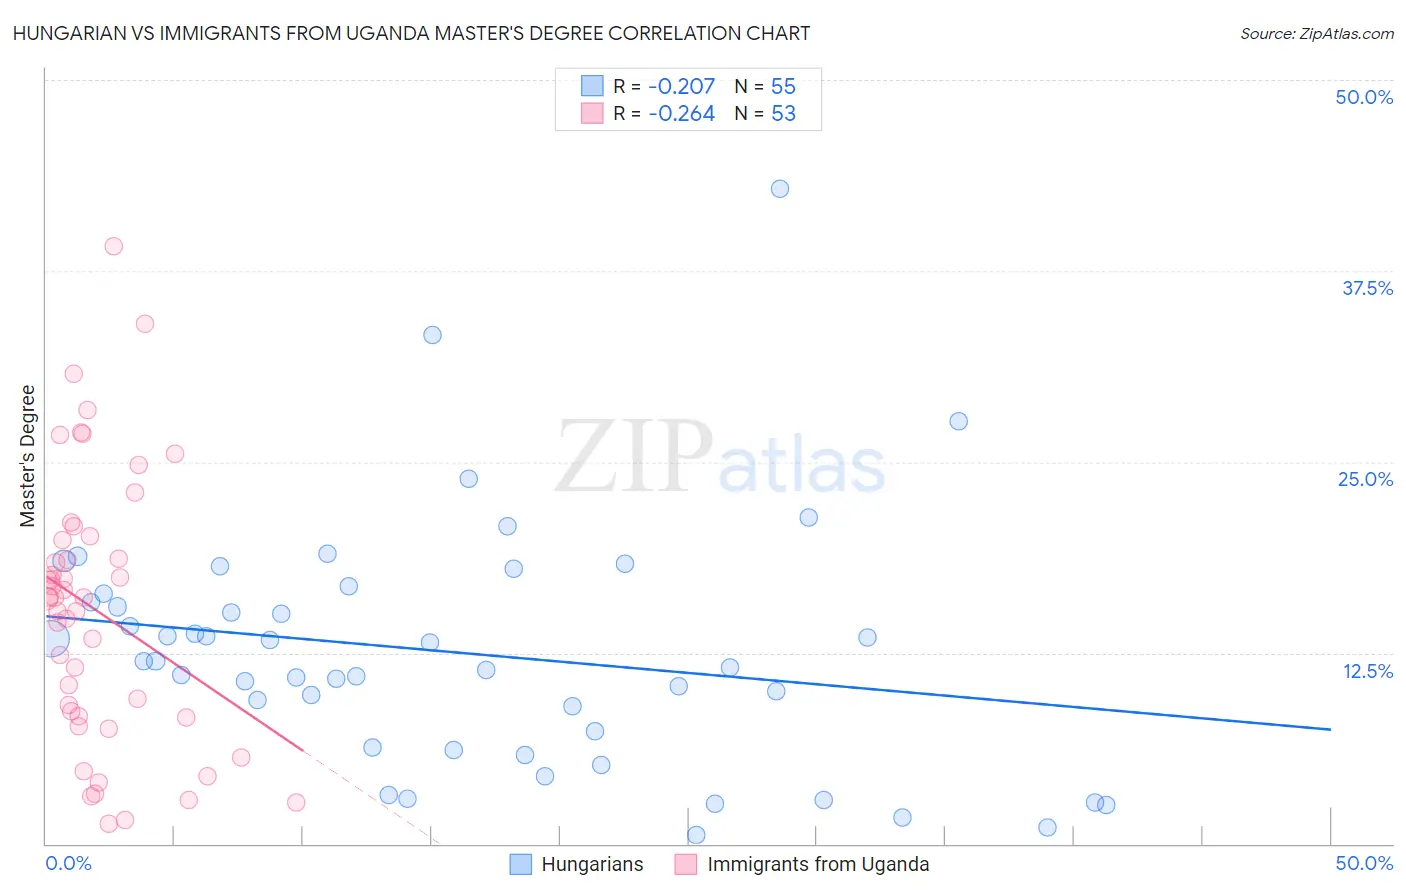
Hungarian vs Immigrants from Uganda Master's Degree Correlation Chart
The statistical analysis conducted on geographies consisting of 485,986,149 people shows a weak negative correlation between the proportion of Hungarians and percentage of population with at least master's degree education in the United States with a correlation coefficient (R) of -0.207 and weighted average of 15.6%. Similarly, the statistical analysis conducted on geographies consisting of 125,956,519 people shows a weak negative correlation between the proportion of Immigrants from Uganda and percentage of population with at least master's degree education in the United States with a correlation coefficient (R) of -0.264 and weighted average of 16.6%, a difference of 7.0%.
Master's Degree Correlation Summary
| Measurement | Hungarian | Immigrants from Uganda |
| Minimum | 0.58% | 1.3% |
| Maximum | 42.9% | 39.1% |
| Range | 42.3% | 37.8% |
| Mean | 12.5% | 15.3% |
| Median | 11.9% | 16.1% |
| Interquartile 25% (IQ1) | 6.3% | 8.3% |
| Interquartile 75% (IQ3) | 16.4% | 20.0% |
| Interquartile Range (IQR) | 10.1% | 11.7% |
| Standard Deviation (Sample) | 8.0% | 8.7% |
| Standard Deviation (Population) | 7.9% | 8.7% |
Similar Demographics by Master's Degree
Demographics Similar to Hungarians by Master's Degree
In terms of master's degree, the demographic groups most similar to Hungarians are Immigrants from Afghanistan (15.6%, a difference of 0.040%), Immigrants from Senegal (15.5%, a difference of 0.17%), Ghanaian (15.5%, a difference of 0.18%), Slovene (15.5%, a difference of 0.21%), and Iraqi (15.5%, a difference of 0.33%).
| Demographics | Rating | Rank | Master's Degree |
| Vietnamese | 85.5 /100 | #140 | Excellent 15.8% |
| Poles | 85.0 /100 | #141 | Excellent 15.7% |
| Immigrants | Africa | 84.0 /100 | #142 | Excellent 15.7% |
| Immigrants | Venezuela | 83.6 /100 | #143 | Excellent 15.7% |
| Canadians | 83.3 /100 | #144 | Excellent 15.7% |
| South Americans | 81.3 /100 | #145 | Excellent 15.6% |
| Immigrants | Afghanistan | 79.4 /100 | #146 | Good 15.6% |
| Hungarians | 79.1 /100 | #147 | Good 15.6% |
| Immigrants | Senegal | 78.2 /100 | #148 | Good 15.5% |
| Ghanaians | 78.2 /100 | #149 | Good 15.5% |
| Slovenes | 78.0 /100 | #150 | Good 15.5% |
| Iraqis | 77.3 /100 | #151 | Good 15.5% |
| Slavs | 77.0 /100 | #152 | Good 15.5% |
| Icelanders | 76.8 /100 | #153 | Good 15.5% |
| Immigrants | South America | 76.3 /100 | #154 | Good 15.5% |
Demographics Similar to Immigrants from Uganda by Master's Degree
In terms of master's degree, the demographic groups most similar to Immigrants from Uganda are Immigrants from Southern Europe (16.6%, a difference of 0.12%), Immigrants from Moldova (16.6%, a difference of 0.13%), Northern European (16.7%, a difference of 0.30%), Arab (16.7%, a difference of 0.37%), and Macedonian (16.7%, a difference of 0.38%).
| Demographics | Rating | Rank | Master's Degree |
| Sierra Leoneans | 98.0 /100 | #108 | Exceptional 16.8% |
| Moroccans | 98.0 /100 | #109 | Exceptional 16.8% |
| Immigrants | Chile | 98.0 /100 | #110 | Exceptional 16.8% |
| Austrians | 97.8 /100 | #111 | Exceptional 16.7% |
| Macedonians | 97.7 /100 | #112 | Exceptional 16.7% |
| Arabs | 97.7 /100 | #113 | Exceptional 16.7% |
| Northern Europeans | 97.6 /100 | #114 | Exceptional 16.7% |
| Immigrants | Uganda | 97.3 /100 | #115 | Exceptional 16.6% |
| Immigrants | Southern Europe | 97.2 /100 | #116 | Exceptional 16.6% |
| Immigrants | Moldova | 97.2 /100 | #117 | Exceptional 16.6% |
| Brazilians | 96.8 /100 | #118 | Exceptional 16.5% |
| Jordanians | 96.5 /100 | #119 | Exceptional 16.5% |
| Lebanese | 96.4 /100 | #120 | Exceptional 16.5% |
| Afghans | 96.2 /100 | #121 | Exceptional 16.5% |
| British | 95.6 /100 | #122 | Exceptional 16.4% |