Hungarian vs Immigrants from Cabo Verde Master's Degree
COMPARE
Hungarian
Immigrants from Cabo Verde
Master's Degree
Master's Degree Comparison
Hungarians
Immigrants from Cabo Verde
15.6%
MASTER'S DEGREE
79.1/ 100
METRIC RATING
147th/ 347
METRIC RANK
11.3%
MASTER'S DEGREE
0.1/ 100
METRIC RATING
304th/ 347
METRIC RANK
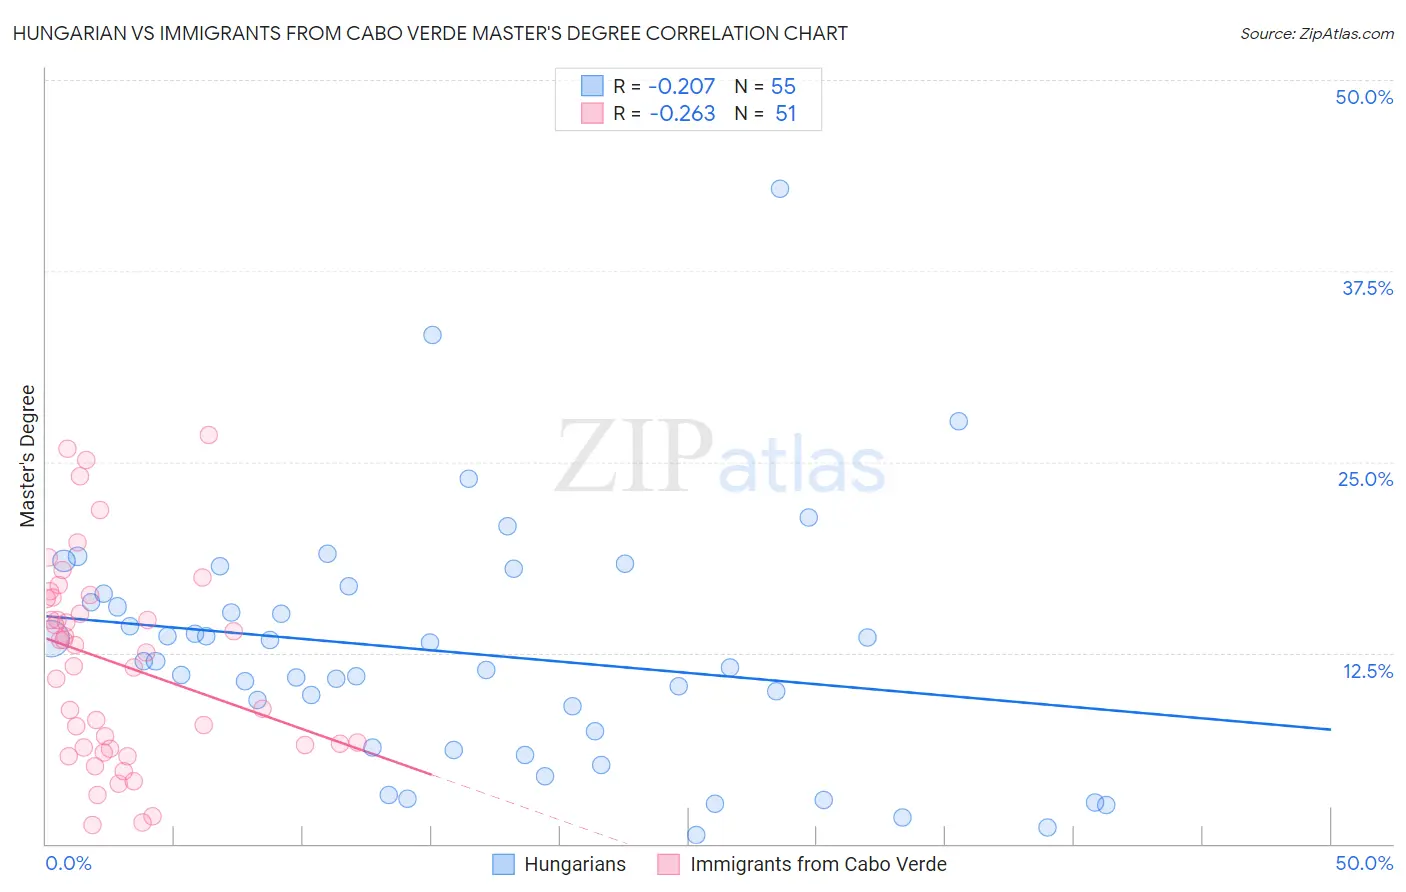
Hungarian vs Immigrants from Cabo Verde Master's Degree Correlation Chart
The statistical analysis conducted on geographies consisting of 485,986,149 people shows a weak negative correlation between the proportion of Hungarians and percentage of population with at least master's degree education in the United States with a correlation coefficient (R) of -0.207 and weighted average of 15.6%. Similarly, the statistical analysis conducted on geographies consisting of 38,158,316 people shows a weak negative correlation between the proportion of Immigrants from Cabo Verde and percentage of population with at least master's degree education in the United States with a correlation coefficient (R) of -0.263 and weighted average of 11.3%, a difference of 37.2%.
Master's Degree Correlation Summary
| Measurement | Hungarian | Immigrants from Cabo Verde |
| Minimum | 0.58% | 1.2% |
| Maximum | 42.9% | 26.8% |
| Range | 42.3% | 25.5% |
| Mean | 12.5% | 11.9% |
| Median | 11.9% | 12.5% |
| Interquartile 25% (IQ1) | 6.3% | 6.3% |
| Interquartile 75% (IQ3) | 16.4% | 16.1% |
| Interquartile Range (IQR) | 10.1% | 9.8% |
| Standard Deviation (Sample) | 8.0% | 6.6% |
| Standard Deviation (Population) | 7.9% | 6.5% |
Similar Demographics by Master's Degree
Demographics Similar to Hungarians by Master's Degree
In terms of master's degree, the demographic groups most similar to Hungarians are Immigrants from Afghanistan (15.6%, a difference of 0.040%), Immigrants from Senegal (15.5%, a difference of 0.17%), Ghanaian (15.5%, a difference of 0.18%), Slovene (15.5%, a difference of 0.21%), and Iraqi (15.5%, a difference of 0.33%).
| Demographics | Rating | Rank | Master's Degree |
| Vietnamese | 85.5 /100 | #140 | Excellent 15.8% |
| Poles | 85.0 /100 | #141 | Excellent 15.7% |
| Immigrants | Africa | 84.0 /100 | #142 | Excellent 15.7% |
| Immigrants | Venezuela | 83.6 /100 | #143 | Excellent 15.7% |
| Canadians | 83.3 /100 | #144 | Excellent 15.7% |
| South Americans | 81.3 /100 | #145 | Excellent 15.6% |
| Immigrants | Afghanistan | 79.4 /100 | #146 | Good 15.6% |
| Hungarians | 79.1 /100 | #147 | Good 15.6% |
| Immigrants | Senegal | 78.2 /100 | #148 | Good 15.5% |
| Ghanaians | 78.2 /100 | #149 | Good 15.5% |
| Slovenes | 78.0 /100 | #150 | Good 15.5% |
| Iraqis | 77.3 /100 | #151 | Good 15.5% |
| Slavs | 77.0 /100 | #152 | Good 15.5% |
| Icelanders | 76.8 /100 | #153 | Good 15.5% |
| Immigrants | South America | 76.3 /100 | #154 | Good 15.5% |
Demographics Similar to Immigrants from Cabo Verde by Master's Degree
In terms of master's degree, the demographic groups most similar to Immigrants from Cabo Verde are Immigrants from Laos (11.4%, a difference of 0.19%), Cherokee (11.4%, a difference of 0.21%), Tsimshian (11.4%, a difference of 0.52%), Immigrants from Latin America (11.3%, a difference of 0.65%), and Chippewa (11.4%, a difference of 0.68%).
| Demographics | Rating | Rank | Master's Degree |
| Immigrants | Yemen | 0.1 /100 | #297 | Tragic 11.6% |
| Samoans | 0.1 /100 | #298 | Tragic 11.5% |
| Chickasaw | 0.1 /100 | #299 | Tragic 11.4% |
| Chippewa | 0.1 /100 | #300 | Tragic 11.4% |
| Tsimshian | 0.1 /100 | #301 | Tragic 11.4% |
| Cherokee | 0.1 /100 | #302 | Tragic 11.4% |
| Immigrants | Laos | 0.1 /100 | #303 | Tragic 11.4% |
| Immigrants | Cabo Verde | 0.1 /100 | #304 | Tragic 11.3% |
| Immigrants | Latin America | 0.0 /100 | #305 | Tragic 11.3% |
| Mexican American Indians | 0.0 /100 | #306 | Tragic 11.2% |
| Cheyenne | 0.0 /100 | #307 | Tragic 11.2% |
| Puerto Ricans | 0.0 /100 | #308 | Tragic 11.2% |
| Puget Sound Salish | 0.0 /100 | #309 | Tragic 11.1% |
| Shoshone | 0.0 /100 | #310 | Tragic 11.1% |
| Seminole | 0.0 /100 | #311 | Tragic 11.0% |