Immigrants from Germany vs Immigrants from Fiji GED/Equivalency
COMPARE
Immigrants from Germany
Immigrants from Fiji
GED/Equivalency
GED/Equivalency Comparison
Immigrants from Germany
Immigrants from Fiji
86.7%
GED/EQUIVALENCY
88.8/ 100
METRIC RATING
130th/ 347
METRIC RANK
82.7%
GED/EQUIVALENCY
0.1/ 100
METRIC RATING
279th/ 347
METRIC RANK
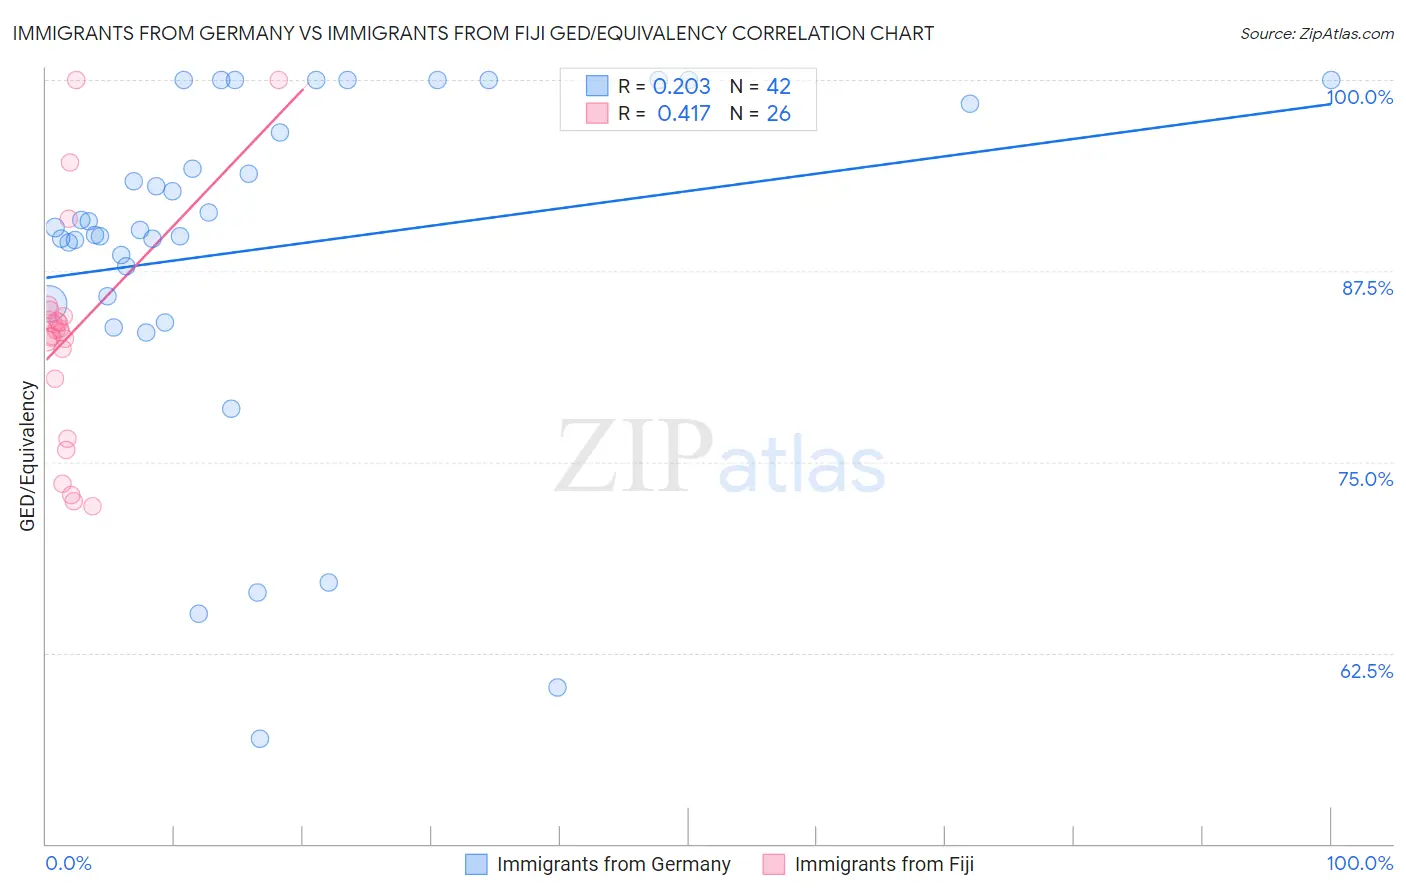
Immigrants from Germany vs Immigrants from Fiji GED/Equivalency Correlation Chart
The statistical analysis conducted on geographies consisting of 463,886,920 people shows a weak positive correlation between the proportion of Immigrants from Germany and percentage of population with at least ged/equivalency education in the United States with a correlation coefficient (R) of 0.203 and weighted average of 86.7%. Similarly, the statistical analysis conducted on geographies consisting of 93,756,204 people shows a moderate positive correlation between the proportion of Immigrants from Fiji and percentage of population with at least ged/equivalency education in the United States with a correlation coefficient (R) of 0.417 and weighted average of 82.7%, a difference of 4.8%.
GED/Equivalency Correlation Summary
| Measurement | Immigrants from Germany | Immigrants from Fiji |
| Minimum | 56.9% | 72.1% |
| Maximum | 100.0% | 100.0% |
| Range | 43.1% | 27.9% |
| Mean | 89.0% | 83.3% |
| Median | 90.3% | 83.6% |
| Interquartile 25% (IQ1) | 85.9% | 80.4% |
| Interquartile 75% (IQ3) | 98.4% | 84.6% |
| Interquartile Range (IQR) | 12.6% | 4.2% |
| Standard Deviation (Sample) | 11.2% | 7.3% |
| Standard Deviation (Population) | 11.0% | 7.1% |
Similar Demographics by GED/Equivalency
Demographics Similar to Immigrants from Germany by GED/Equivalency
In terms of ged/equivalency, the demographic groups most similar to Immigrants from Germany are Immigrants from Ukraine (86.7%, a difference of 0.0%), Immigrants from Spain (86.7%, a difference of 0.020%), Immigrants from Brazil (86.6%, a difference of 0.020%), Yugoslavian (86.7%, a difference of 0.030%), and Tsimshian (86.6%, a difference of 0.030%).
| Demographics | Rating | Rank | GED/Equivalency |
| Immigrants | Italy | 90.5 /100 | #123 | Exceptional 86.7% |
| Immigrants | Egypt | 90.4 /100 | #124 | Exceptional 86.7% |
| Celtics | 90.4 /100 | #125 | Exceptional 86.7% |
| Asians | 90.3 /100 | #126 | Exceptional 86.7% |
| Argentineans | 89.7 /100 | #127 | Excellent 86.7% |
| Yugoslavians | 89.5 /100 | #128 | Excellent 86.7% |
| Immigrants | Ukraine | 88.9 /100 | #129 | Excellent 86.7% |
| Immigrants | Germany | 88.8 /100 | #130 | Excellent 86.7% |
| Immigrants | Spain | 88.5 /100 | #131 | Excellent 86.7% |
| Immigrants | Brazil | 88.4 /100 | #132 | Excellent 86.6% |
| Tsimshian | 88.3 /100 | #133 | Excellent 86.6% |
| Albanians | 87.7 /100 | #134 | Excellent 86.6% |
| Immigrants | Asia | 87.4 /100 | #135 | Excellent 86.6% |
| Chileans | 86.9 /100 | #136 | Excellent 86.6% |
| Arabs | 86.7 /100 | #137 | Excellent 86.6% |
Demographics Similar to Immigrants from Fiji by GED/Equivalency
In terms of ged/equivalency, the demographic groups most similar to Immigrants from Fiji are Immigrants from Laos (82.7%, a difference of 0.010%), Cheyenne (82.7%, a difference of 0.010%), Arapaho (82.8%, a difference of 0.040%), Black/African American (82.8%, a difference of 0.060%), and Seminole (82.8%, a difference of 0.080%).
| Demographics | Rating | Rank | GED/Equivalency |
| Barbadians | 0.1 /100 | #272 | Tragic 82.9% |
| Pennsylvania Germans | 0.1 /100 | #273 | Tragic 82.9% |
| Immigrants | Trinidad and Tobago | 0.1 /100 | #274 | Tragic 82.8% |
| Seminole | 0.1 /100 | #275 | Tragic 82.8% |
| Blacks/African Americans | 0.1 /100 | #276 | Tragic 82.8% |
| Arapaho | 0.1 /100 | #277 | Tragic 82.8% |
| Immigrants | Laos | 0.1 /100 | #278 | Tragic 82.7% |
| Immigrants | Fiji | 0.1 /100 | #279 | Tragic 82.7% |
| Cheyenne | 0.1 /100 | #280 | Tragic 82.7% |
| Sioux | 0.1 /100 | #281 | Tragic 82.6% |
| Immigrants | Immigrants | 0.1 /100 | #282 | Tragic 82.6% |
| Indonesians | 0.1 /100 | #283 | Tragic 82.5% |
| Immigrants | Barbados | 0.1 /100 | #284 | Tragic 82.4% |
| Cajuns | 0.0 /100 | #285 | Tragic 82.4% |
| Immigrants | West Indies | 0.0 /100 | #286 | Tragic 82.4% |