Houma vs Immigrants from Romania GED/Equivalency
COMPARE
Houma
Immigrants from Romania
GED/Equivalency
GED/Equivalency Comparison
Houma
Immigrants from Romania
75.0%
GED/EQUIVALENCY
0.0/ 100
METRIC RATING
346th/ 347
METRIC RANK
87.5%
GED/EQUIVALENCY
98.1/ 100
METRIC RATING
84th/ 347
METRIC RANK
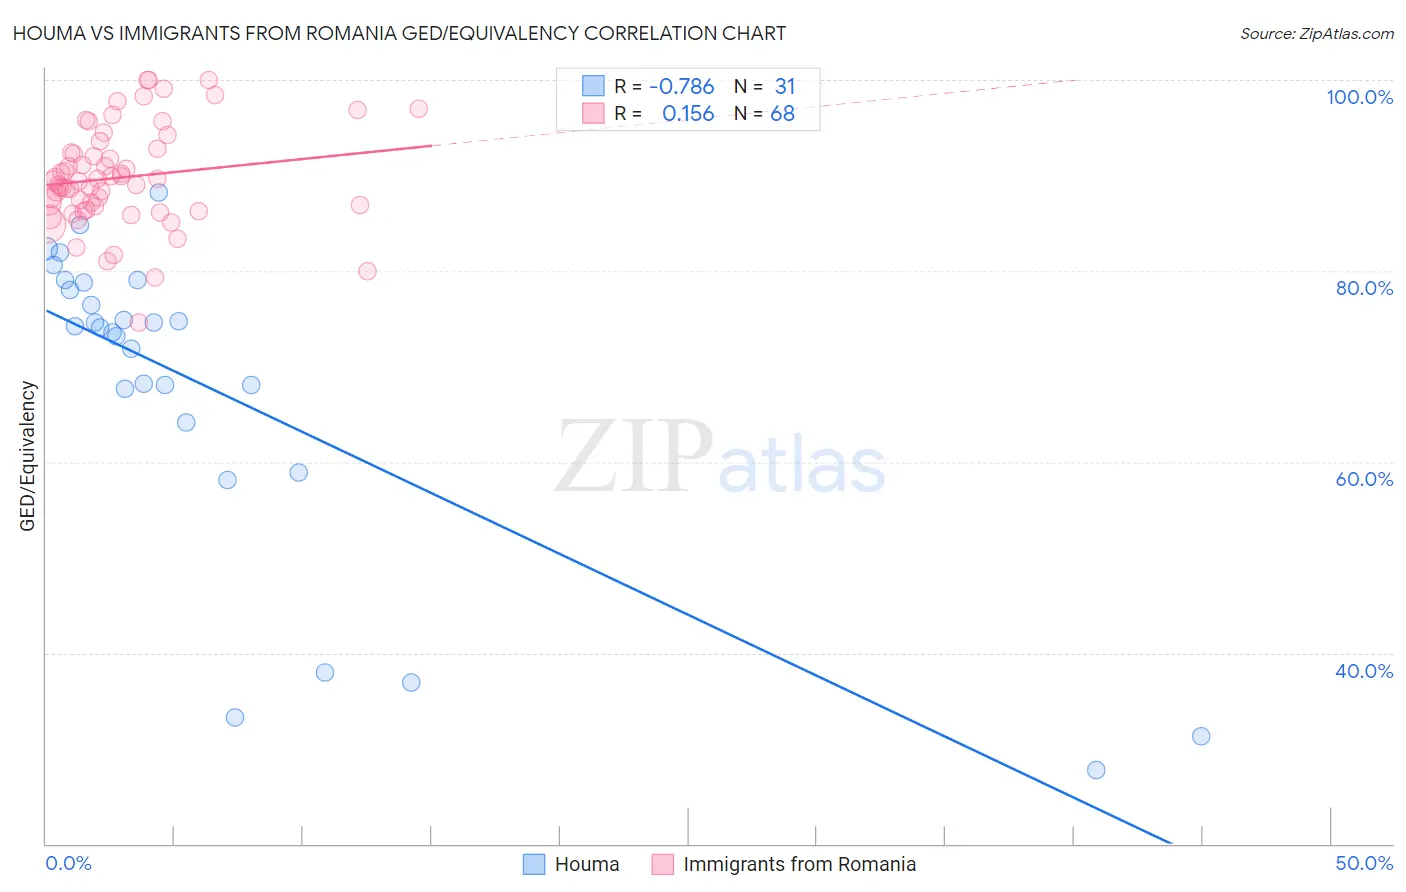
Houma vs Immigrants from Romania GED/Equivalency Correlation Chart
The statistical analysis conducted on geographies consisting of 36,795,916 people shows a strong negative correlation between the proportion of Houma and percentage of population with at least ged/equivalency education in the United States with a correlation coefficient (R) of -0.786 and weighted average of 75.0%. Similarly, the statistical analysis conducted on geographies consisting of 257,013,054 people shows a poor positive correlation between the proportion of Immigrants from Romania and percentage of population with at least ged/equivalency education in the United States with a correlation coefficient (R) of 0.156 and weighted average of 87.5%, a difference of 16.7%.
GED/Equivalency Correlation Summary
| Measurement | Houma | Immigrants from Romania |
| Minimum | 27.8% | 74.6% |
| Maximum | 88.2% | 100.0% |
| Range | 60.4% | 25.4% |
| Mean | 67.6% | 89.8% |
| Median | 74.1% | 89.4% |
| Interquartile 25% (IQ1) | 64.2% | 86.6% |
| Interquartile 75% (IQ3) | 78.8% | 92.7% |
| Interquartile Range (IQR) | 14.6% | 6.1% |
| Standard Deviation (Sample) | 16.7% | 5.3% |
| Standard Deviation (Population) | 16.4% | 5.2% |
Similar Demographics by GED/Equivalency
Demographics Similar to Houma by GED/Equivalency
In terms of ged/equivalency, the demographic groups most similar to Houma are Yakama (74.5%, a difference of 0.61%), Immigrants from Mexico (75.7%, a difference of 0.94%), Spanish American Indian (76.3%, a difference of 1.8%), Immigrants from Central America (76.4%, a difference of 1.9%), and Pima (76.4%, a difference of 2.0%).
| Demographics | Rating | Rank | GED/Equivalency |
| Salvadorans | 0.0 /100 | #333 | Tragic 78.6% |
| Guatemalans | 0.0 /100 | #334 | Tragic 78.5% |
| Immigrants | Latin America | 0.0 /100 | #335 | Tragic 78.5% |
| Immigrants | Dominican Republic | 0.0 /100 | #336 | Tragic 78.0% |
| Immigrants | Yemen | 0.0 /100 | #337 | Tragic 77.9% |
| Immigrants | Guatemala | 0.0 /100 | #338 | Tragic 77.9% |
| Immigrants | El Salvador | 0.0 /100 | #339 | Tragic 77.6% |
| Tohono O'odham | 0.0 /100 | #340 | Tragic 77.5% |
| Mexicans | 0.0 /100 | #341 | Tragic 77.4% |
| Pima | 0.0 /100 | #342 | Tragic 76.4% |
| Immigrants | Central America | 0.0 /100 | #343 | Tragic 76.4% |
| Spanish American Indians | 0.0 /100 | #344 | Tragic 76.3% |
| Immigrants | Mexico | 0.0 /100 | #345 | Tragic 75.7% |
| Houma | 0.0 /100 | #346 | Tragic 75.0% |
| Yakama | 0.0 /100 | #347 | Tragic 74.5% |
Demographics Similar to Immigrants from Romania by GED/Equivalency
In terms of ged/equivalency, the demographic groups most similar to Immigrants from Romania are Dutch (87.5%, a difference of 0.0%), Immigrants from Europe (87.5%, a difference of 0.010%), Native Hawaiian (87.5%, a difference of 0.010%), Immigrants from Norway (87.5%, a difference of 0.020%), and South African (87.5%, a difference of 0.040%).
| Demographics | Rating | Rank | GED/Equivalency |
| Slavs | 98.7 /100 | #77 | Exceptional 87.7% |
| Irish | 98.6 /100 | #78 | Exceptional 87.6% |
| English | 98.6 /100 | #79 | Exceptional 87.6% |
| Immigrants | England | 98.5 /100 | #80 | Exceptional 87.6% |
| Immigrants | Sri Lanka | 98.3 /100 | #81 | Exceptional 87.5% |
| Romanians | 98.3 /100 | #82 | Exceptional 87.5% |
| South Africans | 98.3 /100 | #83 | Exceptional 87.5% |
| Immigrants | Romania | 98.1 /100 | #84 | Exceptional 87.5% |
| Dutch | 98.1 /100 | #85 | Exceptional 87.5% |
| Immigrants | Europe | 98.1 /100 | #86 | Exceptional 87.5% |
| Native Hawaiians | 98.1 /100 | #87 | Exceptional 87.5% |
| Immigrants | Norway | 98.1 /100 | #88 | Exceptional 87.5% |
| Hungarians | 97.9 /100 | #89 | Exceptional 87.4% |
| Welsh | 97.9 /100 | #90 | Exceptional 87.4% |
| Immigrants | Eastern Asia | 97.9 /100 | #91 | Exceptional 87.4% |