Immigrants from Singapore vs Immigrants from Fiji GED/Equivalency
COMPARE
Immigrants from Singapore
Immigrants from Fiji
GED/Equivalency
GED/Equivalency Comparison
Immigrants from Singapore
Immigrants from Fiji
89.3%
GED/EQUIVALENCY
100.0/ 100
METRIC RATING
3rd/ 347
METRIC RANK
82.7%
GED/EQUIVALENCY
0.1/ 100
METRIC RATING
279th/ 347
METRIC RANK
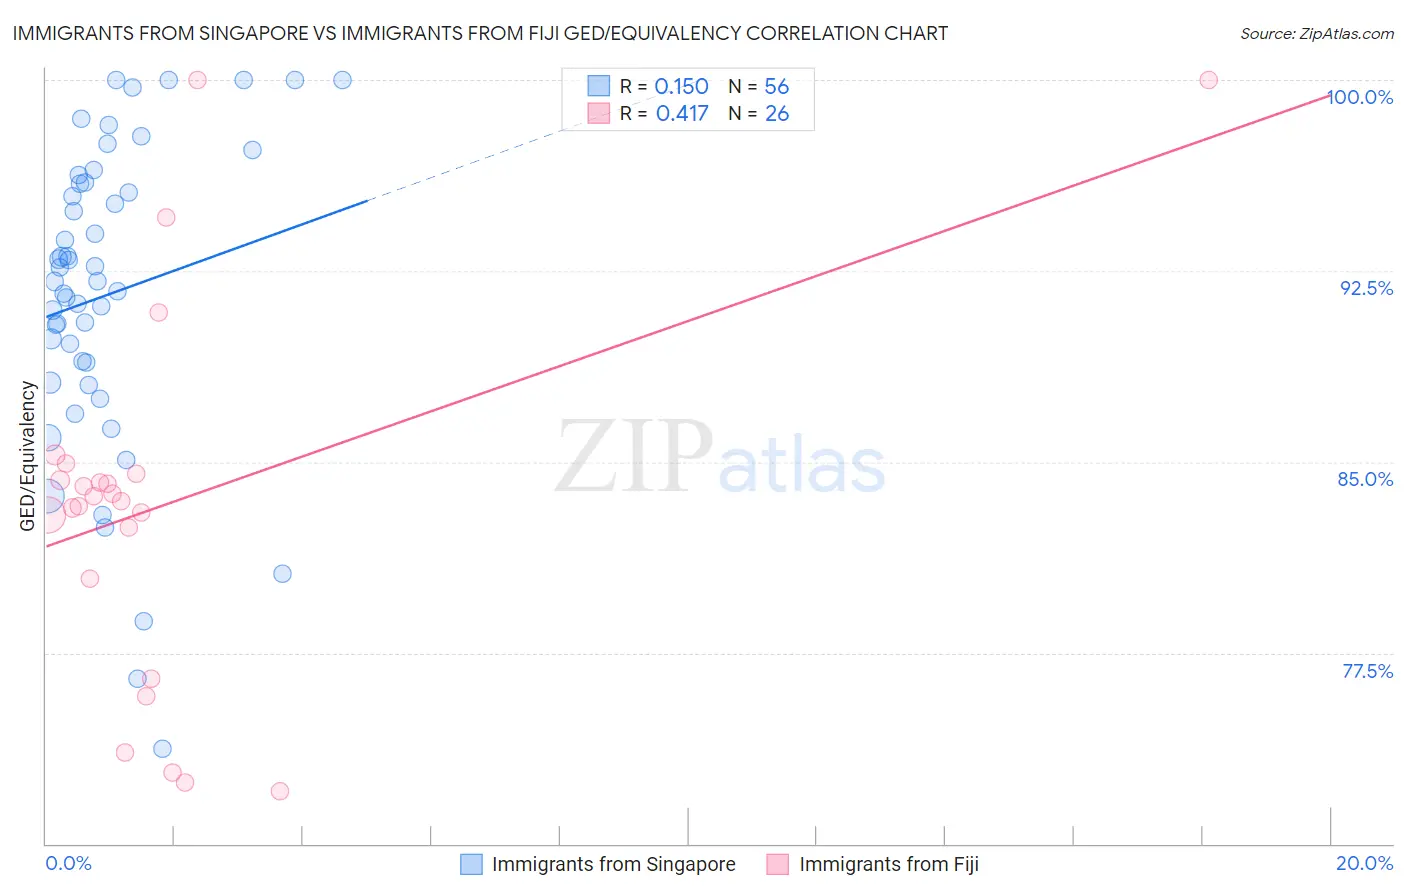
Immigrants from Singapore vs Immigrants from Fiji GED/Equivalency Correlation Chart
The statistical analysis conducted on geographies consisting of 137,521,094 people shows a poor positive correlation between the proportion of Immigrants from Singapore and percentage of population with at least ged/equivalency education in the United States with a correlation coefficient (R) of 0.150 and weighted average of 89.3%. Similarly, the statistical analysis conducted on geographies consisting of 93,756,204 people shows a moderate positive correlation between the proportion of Immigrants from Fiji and percentage of population with at least ged/equivalency education in the United States with a correlation coefficient (R) of 0.417 and weighted average of 82.7%, a difference of 8.0%.
GED/Equivalency Correlation Summary
| Measurement | Immigrants from Singapore | Immigrants from Fiji |
| Minimum | 73.7% | 72.1% |
| Maximum | 100.0% | 100.0% |
| Range | 26.3% | 27.9% |
| Mean | 91.6% | 83.3% |
| Median | 92.1% | 83.6% |
| Interquartile 25% (IQ1) | 88.5% | 80.4% |
| Interquartile 75% (IQ3) | 95.9% | 84.6% |
| Interquartile Range (IQR) | 7.4% | 4.2% |
| Standard Deviation (Sample) | 6.1% | 7.3% |
| Standard Deviation (Population) | 6.0% | 7.1% |
Similar Demographics by GED/Equivalency
Demographics Similar to Immigrants from Singapore by GED/Equivalency
In terms of ged/equivalency, the demographic groups most similar to Immigrants from Singapore are Iranian (89.2%, a difference of 0.090%), Latvian (89.2%, a difference of 0.19%), Thai (89.1%, a difference of 0.20%), Filipino (89.5%, a difference of 0.21%), and Eastern European (89.1%, a difference of 0.25%).
| Demographics | Rating | Rank | GED/Equivalency |
| Immigrants | India | 100.0 /100 | #1 | Exceptional 89.7% |
| Filipinos | 100.0 /100 | #2 | Exceptional 89.5% |
| Immigrants | Singapore | 100.0 /100 | #3 | Exceptional 89.3% |
| Iranians | 100.0 /100 | #4 | Exceptional 89.2% |
| Latvians | 100.0 /100 | #5 | Exceptional 89.2% |
| Thais | 100.0 /100 | #6 | Exceptional 89.1% |
| Eastern Europeans | 99.9 /100 | #7 | Exceptional 89.1% |
| Carpatho Rusyns | 99.9 /100 | #8 | Exceptional 89.1% |
| Chinese | 99.9 /100 | #9 | Exceptional 89.0% |
| Norwegians | 99.9 /100 | #10 | Exceptional 89.0% |
| Bulgarians | 99.9 /100 | #11 | Exceptional 89.0% |
| Lithuanians | 99.9 /100 | #12 | Exceptional 88.9% |
| Immigrants | Iran | 99.9 /100 | #13 | Exceptional 88.9% |
| Cypriots | 99.9 /100 | #14 | Exceptional 88.9% |
| Okinawans | 99.9 /100 | #15 | Exceptional 88.9% |
Demographics Similar to Immigrants from Fiji by GED/Equivalency
In terms of ged/equivalency, the demographic groups most similar to Immigrants from Fiji are Immigrants from Laos (82.7%, a difference of 0.010%), Cheyenne (82.7%, a difference of 0.010%), Arapaho (82.8%, a difference of 0.040%), Black/African American (82.8%, a difference of 0.060%), and Seminole (82.8%, a difference of 0.080%).
| Demographics | Rating | Rank | GED/Equivalency |
| Barbadians | 0.1 /100 | #272 | Tragic 82.9% |
| Pennsylvania Germans | 0.1 /100 | #273 | Tragic 82.9% |
| Immigrants | Trinidad and Tobago | 0.1 /100 | #274 | Tragic 82.8% |
| Seminole | 0.1 /100 | #275 | Tragic 82.8% |
| Blacks/African Americans | 0.1 /100 | #276 | Tragic 82.8% |
| Arapaho | 0.1 /100 | #277 | Tragic 82.8% |
| Immigrants | Laos | 0.1 /100 | #278 | Tragic 82.7% |
| Immigrants | Fiji | 0.1 /100 | #279 | Tragic 82.7% |
| Cheyenne | 0.1 /100 | #280 | Tragic 82.7% |
| Sioux | 0.1 /100 | #281 | Tragic 82.6% |
| Immigrants | Immigrants | 0.1 /100 | #282 | Tragic 82.6% |
| Indonesians | 0.1 /100 | #283 | Tragic 82.5% |
| Immigrants | Barbados | 0.1 /100 | #284 | Tragic 82.4% |
| Cajuns | 0.0 /100 | #285 | Tragic 82.4% |
| Immigrants | West Indies | 0.0 /100 | #286 | Tragic 82.4% |