Houma vs Menominee GED/Equivalency
COMPARE
Houma
Menominee
GED/Equivalency
GED/Equivalency Comparison
Houma
Menominee
75.0%
GED/EQUIVALENCY
0.0/ 100
METRIC RATING
346th/ 347
METRIC RANK
86.3%
GED/EQUIVALENCY
79.3/ 100
METRIC RATING
149th/ 347
METRIC RANK
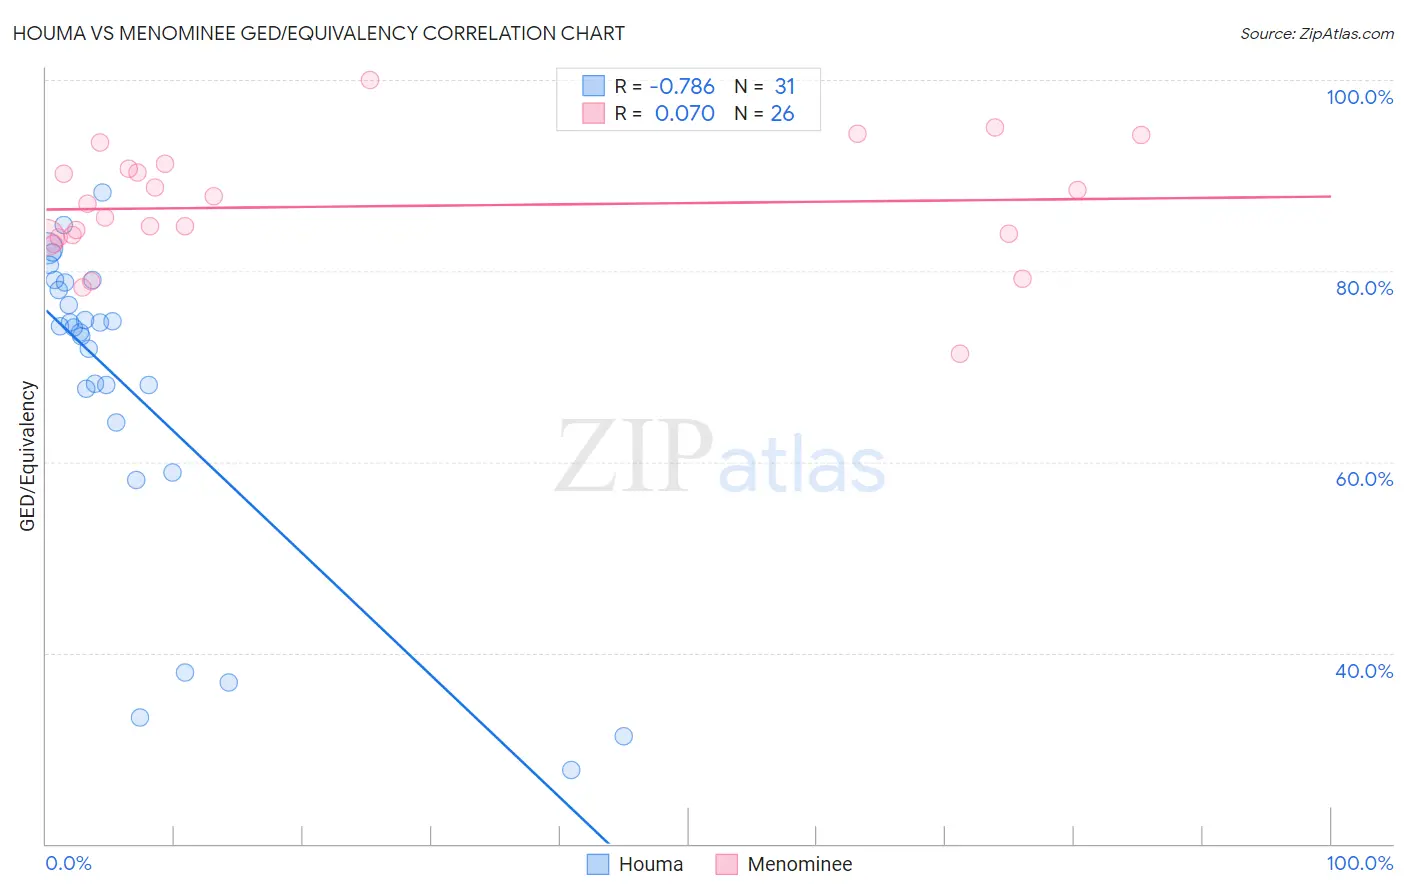
Houma vs Menominee GED/Equivalency Correlation Chart
The statistical analysis conducted on geographies consisting of 36,795,916 people shows a strong negative correlation between the proportion of Houma and percentage of population with at least ged/equivalency education in the United States with a correlation coefficient (R) of -0.786 and weighted average of 75.0%. Similarly, the statistical analysis conducted on geographies consisting of 45,778,979 people shows a slight positive correlation between the proportion of Menominee and percentage of population with at least ged/equivalency education in the United States with a correlation coefficient (R) of 0.070 and weighted average of 86.3%, a difference of 15.2%.
GED/Equivalency Correlation Summary
| Measurement | Houma | Menominee |
| Minimum | 27.8% | 71.3% |
| Maximum | 88.2% | 100.0% |
| Range | 60.4% | 28.7% |
| Mean | 67.6% | 86.8% |
| Median | 74.1% | 86.3% |
| Interquartile 25% (IQ1) | 64.2% | 83.6% |
| Interquartile 75% (IQ3) | 78.8% | 90.6% |
| Interquartile Range (IQR) | 14.6% | 7.1% |
| Standard Deviation (Sample) | 16.7% | 6.2% |
| Standard Deviation (Population) | 16.4% | 6.1% |
Similar Demographics by GED/Equivalency
Demographics Similar to Houma by GED/Equivalency
In terms of ged/equivalency, the demographic groups most similar to Houma are Yakama (74.5%, a difference of 0.61%), Immigrants from Mexico (75.7%, a difference of 0.94%), Spanish American Indian (76.3%, a difference of 1.8%), Immigrants from Central America (76.4%, a difference of 1.9%), and Pima (76.4%, a difference of 2.0%).
| Demographics | Rating | Rank | GED/Equivalency |
| Salvadorans | 0.0 /100 | #333 | Tragic 78.6% |
| Guatemalans | 0.0 /100 | #334 | Tragic 78.5% |
| Immigrants | Latin America | 0.0 /100 | #335 | Tragic 78.5% |
| Immigrants | Dominican Republic | 0.0 /100 | #336 | Tragic 78.0% |
| Immigrants | Yemen | 0.0 /100 | #337 | Tragic 77.9% |
| Immigrants | Guatemala | 0.0 /100 | #338 | Tragic 77.9% |
| Immigrants | El Salvador | 0.0 /100 | #339 | Tragic 77.6% |
| Tohono O'odham | 0.0 /100 | #340 | Tragic 77.5% |
| Mexicans | 0.0 /100 | #341 | Tragic 77.4% |
| Pima | 0.0 /100 | #342 | Tragic 76.4% |
| Immigrants | Central America | 0.0 /100 | #343 | Tragic 76.4% |
| Spanish American Indians | 0.0 /100 | #344 | Tragic 76.3% |
| Immigrants | Mexico | 0.0 /100 | #345 | Tragic 75.7% |
| Houma | 0.0 /100 | #346 | Tragic 75.0% |
| Yakama | 0.0 /100 | #347 | Tragic 74.5% |
Demographics Similar to Menominee by GED/Equivalency
In terms of ged/equivalency, the demographic groups most similar to Menominee are Immigrants from Northern Africa (86.3%, a difference of 0.0%), Immigrants from Poland (86.3%, a difference of 0.0%), Basque (86.4%, a difference of 0.010%), Immigrants from Western Asia (86.3%, a difference of 0.010%), and Pakistani (86.4%, a difference of 0.040%).
| Demographics | Rating | Rank | GED/Equivalency |
| Immigrants | Indonesia | 82.4 /100 | #142 | Excellent 86.4% |
| Immigrants | Pakistan | 82.4 /100 | #143 | Excellent 86.4% |
| Bolivians | 82.1 /100 | #144 | Excellent 86.4% |
| Pakistanis | 80.4 /100 | #145 | Excellent 86.4% |
| Basques | 79.5 /100 | #146 | Good 86.4% |
| Immigrants | Northern Africa | 79.3 /100 | #147 | Good 86.3% |
| Immigrants | Poland | 79.3 /100 | #148 | Good 86.3% |
| Menominee | 79.3 /100 | #149 | Good 86.3% |
| Immigrants | Western Asia | 78.8 /100 | #150 | Good 86.3% |
| Immigrants | Bosnia and Herzegovina | 77.9 /100 | #151 | Good 86.3% |
| Brazilians | 77.2 /100 | #152 | Good 86.3% |
| Kenyans | 76.6 /100 | #153 | Good 86.3% |
| Armenians | 76.4 /100 | #154 | Good 86.3% |
| Iraqis | 75.2 /100 | #155 | Good 86.2% |
| Immigrants | Nepal | 73.3 /100 | #156 | Good 86.2% |