Spanish American vs Immigrants from Fiji GED/Equivalency
COMPARE
Spanish American
Immigrants from Fiji
GED/Equivalency
GED/Equivalency Comparison
Spanish Americans
Immigrants from Fiji
83.6%
GED/EQUIVALENCY
0.8/ 100
METRIC RATING
251st/ 347
METRIC RANK
82.7%
GED/EQUIVALENCY
0.1/ 100
METRIC RATING
279th/ 347
METRIC RANK
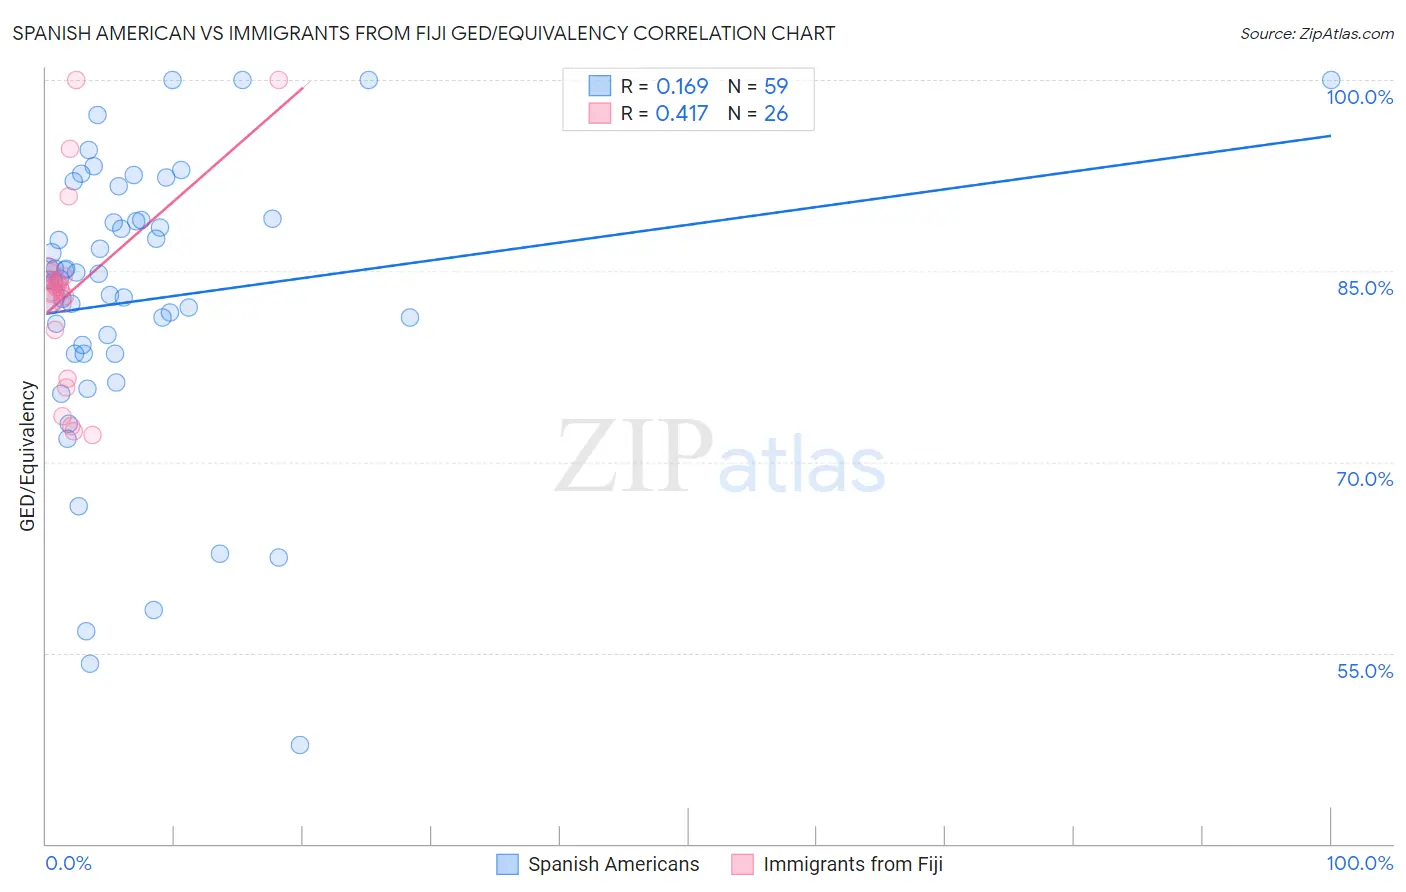
Spanish American vs Immigrants from Fiji GED/Equivalency Correlation Chart
The statistical analysis conducted on geographies consisting of 103,168,542 people shows a poor positive correlation between the proportion of Spanish Americans and percentage of population with at least ged/equivalency education in the United States with a correlation coefficient (R) of 0.169 and weighted average of 83.6%. Similarly, the statistical analysis conducted on geographies consisting of 93,756,204 people shows a moderate positive correlation between the proportion of Immigrants from Fiji and percentage of population with at least ged/equivalency education in the United States with a correlation coefficient (R) of 0.417 and weighted average of 82.7%, a difference of 1.1%.
GED/Equivalency Correlation Summary
| Measurement | Spanish American | Immigrants from Fiji |
| Minimum | 47.7% | 72.1% |
| Maximum | 100.0% | 100.0% |
| Range | 52.3% | 27.9% |
| Mean | 82.7% | 83.3% |
| Median | 84.3% | 83.6% |
| Interquartile 25% (IQ1) | 78.5% | 80.4% |
| Interquartile 75% (IQ3) | 89.0% | 84.6% |
| Interquartile Range (IQR) | 10.5% | 4.2% |
| Standard Deviation (Sample) | 11.3% | 7.3% |
| Standard Deviation (Population) | 11.2% | 7.1% |
Similar Demographics by GED/Equivalency
Demographics Similar to Spanish Americans by GED/Equivalency
In terms of ged/equivalency, the demographic groups most similar to Spanish Americans are Bahamian (83.6%, a difference of 0.0%), Comanche (83.6%, a difference of 0.060%), Creek (83.6%, a difference of 0.090%), Shoshone (83.7%, a difference of 0.15%), and Crow (83.8%, a difference of 0.16%).
| Demographics | Rating | Rank | GED/Equivalency |
| Immigrants | Ghana | 1.3 /100 | #244 | Tragic 83.9% |
| Immigrants | Senegal | 1.2 /100 | #245 | Tragic 83.8% |
| Chickasaw | 1.2 /100 | #246 | Tragic 83.8% |
| Immigrants | Western Africa | 1.1 /100 | #247 | Tragic 83.8% |
| Blackfeet | 1.1 /100 | #248 | Tragic 83.8% |
| Crow | 1.1 /100 | #249 | Tragic 83.8% |
| Shoshone | 1.0 /100 | #250 | Tragic 83.7% |
| Spanish Americans | 0.8 /100 | #251 | Tragic 83.6% |
| Bahamians | 0.8 /100 | #252 | Tragic 83.6% |
| Comanche | 0.7 /100 | #253 | Tragic 83.6% |
| Creek | 0.7 /100 | #254 | Tragic 83.6% |
| Colville | 0.5 /100 | #255 | Tragic 83.4% |
| Africans | 0.5 /100 | #256 | Tragic 83.4% |
| Jamaicans | 0.4 /100 | #257 | Tragic 83.3% |
| Malaysians | 0.4 /100 | #258 | Tragic 83.3% |
Demographics Similar to Immigrants from Fiji by GED/Equivalency
In terms of ged/equivalency, the demographic groups most similar to Immigrants from Fiji are Immigrants from Laos (82.7%, a difference of 0.010%), Cheyenne (82.7%, a difference of 0.010%), Arapaho (82.8%, a difference of 0.040%), Black/African American (82.8%, a difference of 0.060%), and Seminole (82.8%, a difference of 0.080%).
| Demographics | Rating | Rank | GED/Equivalency |
| Barbadians | 0.1 /100 | #272 | Tragic 82.9% |
| Pennsylvania Germans | 0.1 /100 | #273 | Tragic 82.9% |
| Immigrants | Trinidad and Tobago | 0.1 /100 | #274 | Tragic 82.8% |
| Seminole | 0.1 /100 | #275 | Tragic 82.8% |
| Blacks/African Americans | 0.1 /100 | #276 | Tragic 82.8% |
| Arapaho | 0.1 /100 | #277 | Tragic 82.8% |
| Immigrants | Laos | 0.1 /100 | #278 | Tragic 82.7% |
| Immigrants | Fiji | 0.1 /100 | #279 | Tragic 82.7% |
| Cheyenne | 0.1 /100 | #280 | Tragic 82.7% |
| Sioux | 0.1 /100 | #281 | Tragic 82.6% |
| Immigrants | Immigrants | 0.1 /100 | #282 | Tragic 82.6% |
| Indonesians | 0.1 /100 | #283 | Tragic 82.5% |
| Immigrants | Barbados | 0.1 /100 | #284 | Tragic 82.4% |
| Cajuns | 0.0 /100 | #285 | Tragic 82.4% |
| Immigrants | West Indies | 0.0 /100 | #286 | Tragic 82.4% |