Haitian vs Polish Single Male Poverty
COMPARE
Haitian
Polish
Single Male Poverty
Single Male Poverty Comparison
Haitians
Poles
13.2%
SINGLE MALE POVERTY
7.0/ 100
METRIC RATING
227th/ 347
METRIC RANK
13.0%
SINGLE MALE POVERTY
19.3/ 100
METRIC RATING
205th/ 347
METRIC RANK
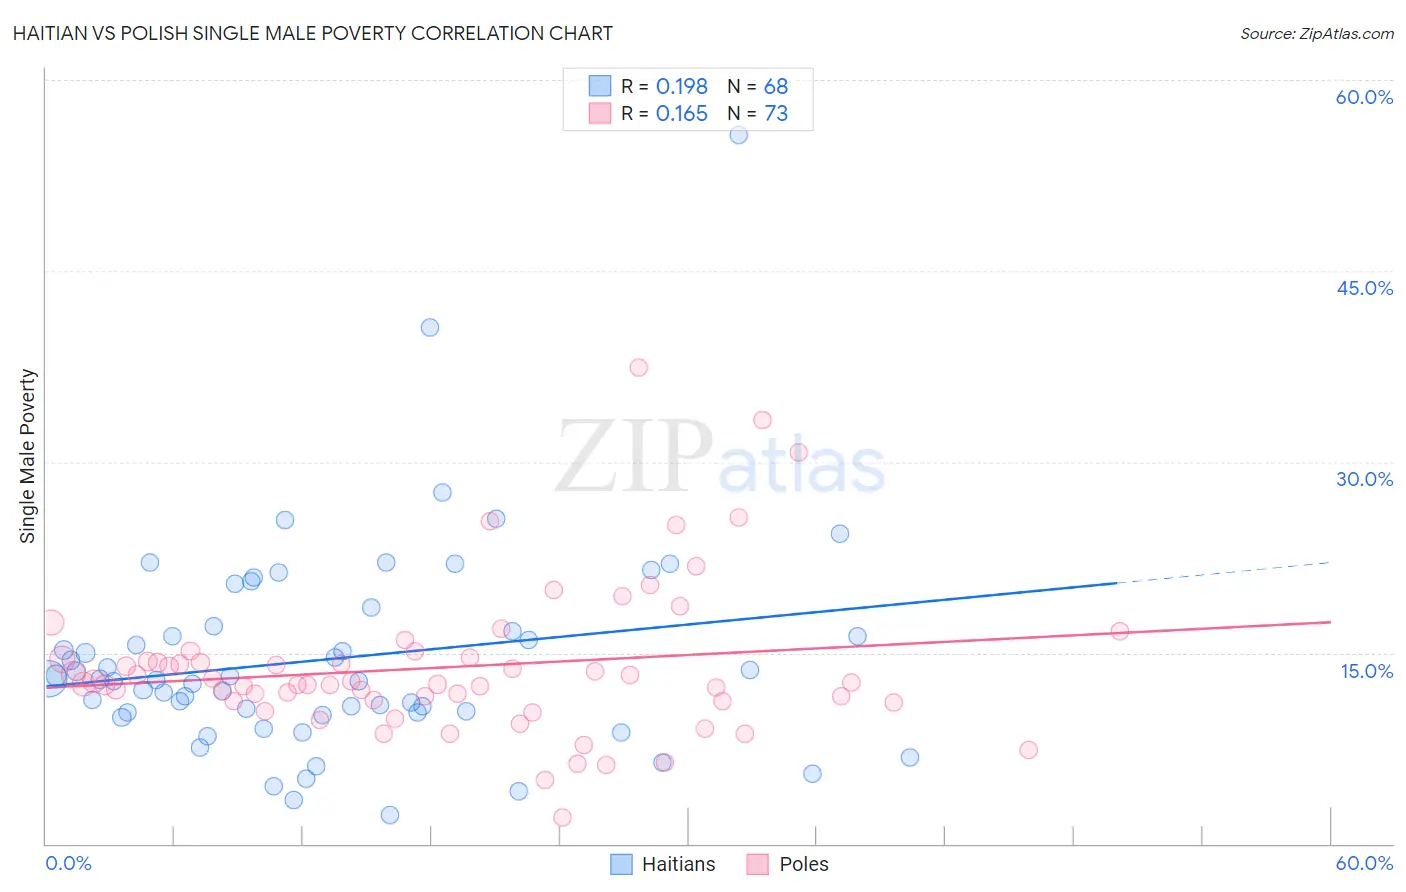
Haitian vs Polish Single Male Poverty Correlation Chart
The statistical analysis conducted on geographies consisting of 262,577,789 people shows a poor positive correlation between the proportion of Haitians and poverty level among single males in the United States with a correlation coefficient (R) of 0.198 and weighted average of 13.2%. Similarly, the statistical analysis conducted on geographies consisting of 463,988,373 people shows a poor positive correlation between the proportion of Poles and poverty level among single males in the United States with a correlation coefficient (R) of 0.165 and weighted average of 13.0%, a difference of 1.5%.
Single Male Poverty Correlation Summary
| Measurement | Haitian | Polish |
| Minimum | 2.3% | 2.0% |
| Maximum | 55.7% | 37.4% |
| Range | 53.4% | 35.4% |
| Mean | 14.5% | 13.9% |
| Median | 12.9% | 12.5% |
| Interquartile 25% (IQ1) | 10.3% | 11.2% |
| Interquartile 75% (IQ3) | 16.9% | 14.6% |
| Interquartile Range (IQR) | 6.6% | 3.4% |
| Standard Deviation (Sample) | 8.3% | 6.0% |
| Standard Deviation (Population) | 8.2% | 6.0% |
Similar Demographics by Single Male Poverty
Demographics Similar to Haitians by Single Male Poverty
In terms of single male poverty, the demographic groups most similar to Haitians are Lebanese (13.2%, a difference of 0.080%), Jamaican (13.2%, a difference of 0.13%), European (13.3%, a difference of 0.17%), Ghanaian (13.3%, a difference of 0.20%), and Immigrants from Denmark (13.2%, a difference of 0.30%).
| Demographics | Rating | Rank | Single Male Poverty |
| Central Americans | 10.9 /100 | #220 | Poor 13.2% |
| New Zealanders | 10.7 /100 | #221 | Poor 13.2% |
| Immigrants | Western Europe | 10.0 /100 | #222 | Poor 13.2% |
| Immigrants | Azores | 9.3 /100 | #223 | Tragic 13.2% |
| Somalis | 9.1 /100 | #224 | Tragic 13.2% |
| Immigrants | Denmark | 8.7 /100 | #225 | Tragic 13.2% |
| Jamaicans | 7.7 /100 | #226 | Tragic 13.2% |
| Haitians | 7.0 /100 | #227 | Tragic 13.2% |
| Lebanese | 6.6 /100 | #228 | Tragic 13.2% |
| Europeans | 6.2 /100 | #229 | Tragic 13.3% |
| Ghanaians | 6.1 /100 | #230 | Tragic 13.3% |
| Slavs | 5.3 /100 | #231 | Tragic 13.3% |
| Immigrants | Caribbean | 5.0 /100 | #232 | Tragic 13.3% |
| British | 4.0 /100 | #233 | Tragic 13.3% |
| Canadians | 4.0 /100 | #234 | Tragic 13.3% |
Demographics Similar to Poles by Single Male Poverty
In terms of single male poverty, the demographic groups most similar to Poles are Northern European (13.0%, a difference of 0.040%), Estonian (13.0%, a difference of 0.080%), Immigrants from Bangladesh (13.0%, a difference of 0.090%), Basque (13.0%, a difference of 0.11%), and Sudanese (13.1%, a difference of 0.14%).
| Demographics | Rating | Rank | Single Male Poverty |
| Lithuanians | 22.1 /100 | #198 | Fair 13.0% |
| Immigrants | Norway | 21.8 /100 | #199 | Fair 13.0% |
| Slovenes | 21.6 /100 | #200 | Fair 13.0% |
| Trinidadians and Tobagonians | 21.4 /100 | #201 | Fair 13.0% |
| Basques | 20.7 /100 | #202 | Fair 13.0% |
| Immigrants | Bangladesh | 20.4 /100 | #203 | Fair 13.0% |
| Estonians | 20.3 /100 | #204 | Fair 13.0% |
| Poles | 19.3 /100 | #205 | Poor 13.0% |
| Northern Europeans | 18.9 /100 | #206 | Poor 13.0% |
| Sudanese | 17.7 /100 | #207 | Poor 13.1% |
| Immigrants | Western Africa | 17.6 /100 | #208 | Poor 13.1% |
| Mexican American Indians | 17.5 /100 | #209 | Poor 13.1% |
| Immigrants | Haiti | 16.8 /100 | #210 | Poor 13.1% |
| Swedes | 16.8 /100 | #211 | Poor 13.1% |
| Senegalese | 16.4 /100 | #212 | Poor 13.1% |