Immigrants from China vs Polish College, Under 1 year
COMPARE
Immigrants from China
Polish
College, Under 1 year
College, Under 1 year Comparison
Immigrants from China
Poles
70.9%
COLLEGE, UNDER 1 YEAR
99.9/ 100
METRIC RATING
30th/ 347
METRIC RANK
66.9%
COLLEGE, UNDER 1 YEAR
88.4/ 100
METRIC RATING
132nd/ 347
METRIC RANK
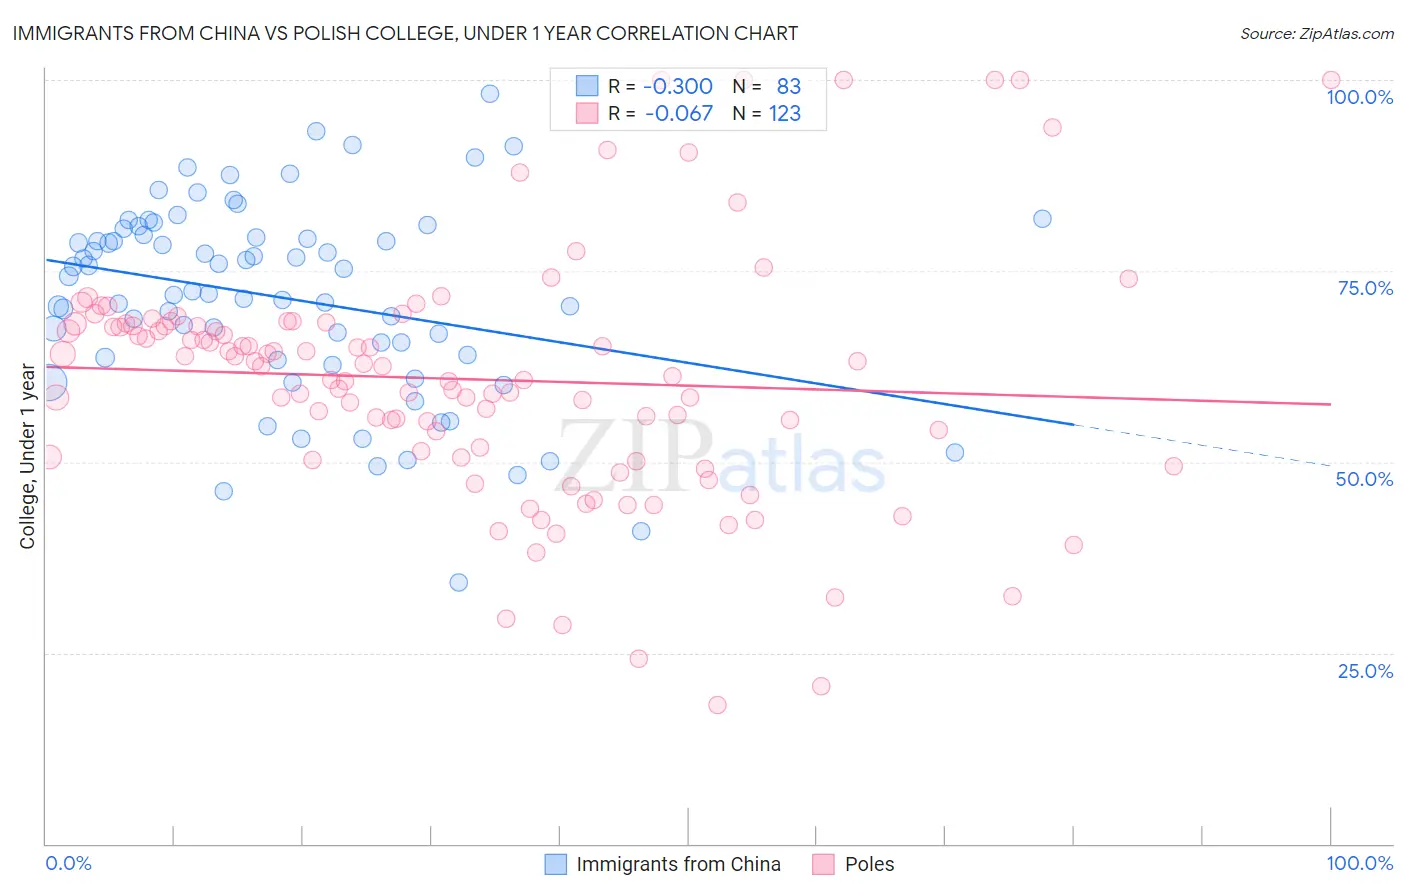
Immigrants from China vs Polish College, Under 1 year Correlation Chart
The statistical analysis conducted on geographies consisting of 457,079,223 people shows a mild negative correlation between the proportion of Immigrants from China and percentage of population with at least college, under 1 year education in the United States with a correlation coefficient (R) of -0.300 and weighted average of 70.9%. Similarly, the statistical analysis conducted on geographies consisting of 560,588,351 people shows a slight negative correlation between the proportion of Poles and percentage of population with at least college, under 1 year education in the United States with a correlation coefficient (R) of -0.067 and weighted average of 66.9%, a difference of 5.9%.
College, Under 1 year Correlation Summary
| Measurement | Immigrants from China | Polish |
| Minimum | 34.2% | 18.2% |
| Maximum | 98.2% | 100.0% |
| Range | 64.0% | 81.8% |
| Mean | 71.4% | 60.8% |
| Median | 72.4% | 62.5% |
| Interquartile 25% (IQ1) | 63.6% | 50.6% |
| Interquartile 75% (IQ3) | 79.7% | 68.1% |
| Interquartile Range (IQR) | 16.1% | 17.4% |
| Standard Deviation (Sample) | 12.8% | 16.0% |
| Standard Deviation (Population) | 12.7% | 15.9% |
Similar Demographics by College, Under 1 year
Demographics Similar to Immigrants from China by College, Under 1 year
In terms of college, under 1 year, the demographic groups most similar to Immigrants from China are Indian (Asian) (70.8%, a difference of 0.11%), Immigrants from Hong Kong (71.0%, a difference of 0.18%), Immigrants from France (71.0%, a difference of 0.18%), Turkish (70.7%, a difference of 0.19%), and Immigrants from Ireland (71.0%, a difference of 0.21%).
| Demographics | Rating | Rank | College, Under 1 year |
| Immigrants | Northern Europe | 100.0 /100 | #23 | Exceptional 71.1% |
| Soviet Union | 100.0 /100 | #24 | Exceptional 71.1% |
| Bulgarians | 100.0 /100 | #25 | Exceptional 71.1% |
| Immigrants | Denmark | 100.0 /100 | #26 | Exceptional 71.0% |
| Immigrants | Ireland | 100.0 /100 | #27 | Exceptional 71.0% |
| Immigrants | Hong Kong | 100.0 /100 | #28 | Exceptional 71.0% |
| Immigrants | France | 100.0 /100 | #29 | Exceptional 71.0% |
| Immigrants | China | 99.9 /100 | #30 | Exceptional 70.9% |
| Indians (Asian) | 99.9 /100 | #31 | Exceptional 70.8% |
| Turks | 99.9 /100 | #32 | Exceptional 70.7% |
| Immigrants | South Africa | 99.9 /100 | #33 | Exceptional 70.6% |
| Estonians | 99.9 /100 | #34 | Exceptional 70.6% |
| Russians | 99.9 /100 | #35 | Exceptional 70.5% |
| Immigrants | Sri Lanka | 99.9 /100 | #36 | Exceptional 70.5% |
| Immigrants | Saudi Arabia | 99.9 /100 | #37 | Exceptional 70.4% |
Demographics Similar to Poles by College, Under 1 year
In terms of college, under 1 year, the demographic groups most similar to Poles are Immigrants from Brazil (66.9%, a difference of 0.010%), Finnish (66.9%, a difference of 0.020%), Iraqi (66.8%, a difference of 0.050%), Immigrants from Syria (66.9%, a difference of 0.060%), and Canadian (66.8%, a difference of 0.060%).
| Demographics | Rating | Rank | College, Under 1 year |
| Italians | 91.8 /100 | #125 | Exceptional 67.2% |
| Alsatians | 91.3 /100 | #126 | Exceptional 67.1% |
| Czechs | 90.8 /100 | #127 | Exceptional 67.1% |
| Scottish | 90.2 /100 | #128 | Exceptional 67.0% |
| Immigrants | Eastern Africa | 89.5 /100 | #129 | Excellent 67.0% |
| Immigrants | Syria | 89.0 /100 | #130 | Excellent 66.9% |
| Finns | 88.6 /100 | #131 | Excellent 66.9% |
| Poles | 88.4 /100 | #132 | Excellent 66.9% |
| Immigrants | Brazil | 88.3 /100 | #133 | Excellent 66.9% |
| Iraqis | 88.0 /100 | #134 | Excellent 66.8% |
| Canadians | 87.9 /100 | #135 | Excellent 66.8% |
| Ugandans | 87.8 /100 | #136 | Excellent 66.8% |
| Immigrants | Chile | 87.4 /100 | #137 | Excellent 66.8% |
| Immigrants | Italy | 86.9 /100 | #138 | Excellent 66.8% |
| Venezuelans | 85.9 /100 | #139 | Excellent 66.7% |