Mongolian vs Polish College, Under 1 year
COMPARE
Mongolian
Polish
College, Under 1 year
College, Under 1 year Comparison
Mongolians
Poles
69.9%
COLLEGE, UNDER 1 YEAR
99.8/ 100
METRIC RATING
51st/ 347
METRIC RANK
66.9%
COLLEGE, UNDER 1 YEAR
88.4/ 100
METRIC RATING
132nd/ 347
METRIC RANK
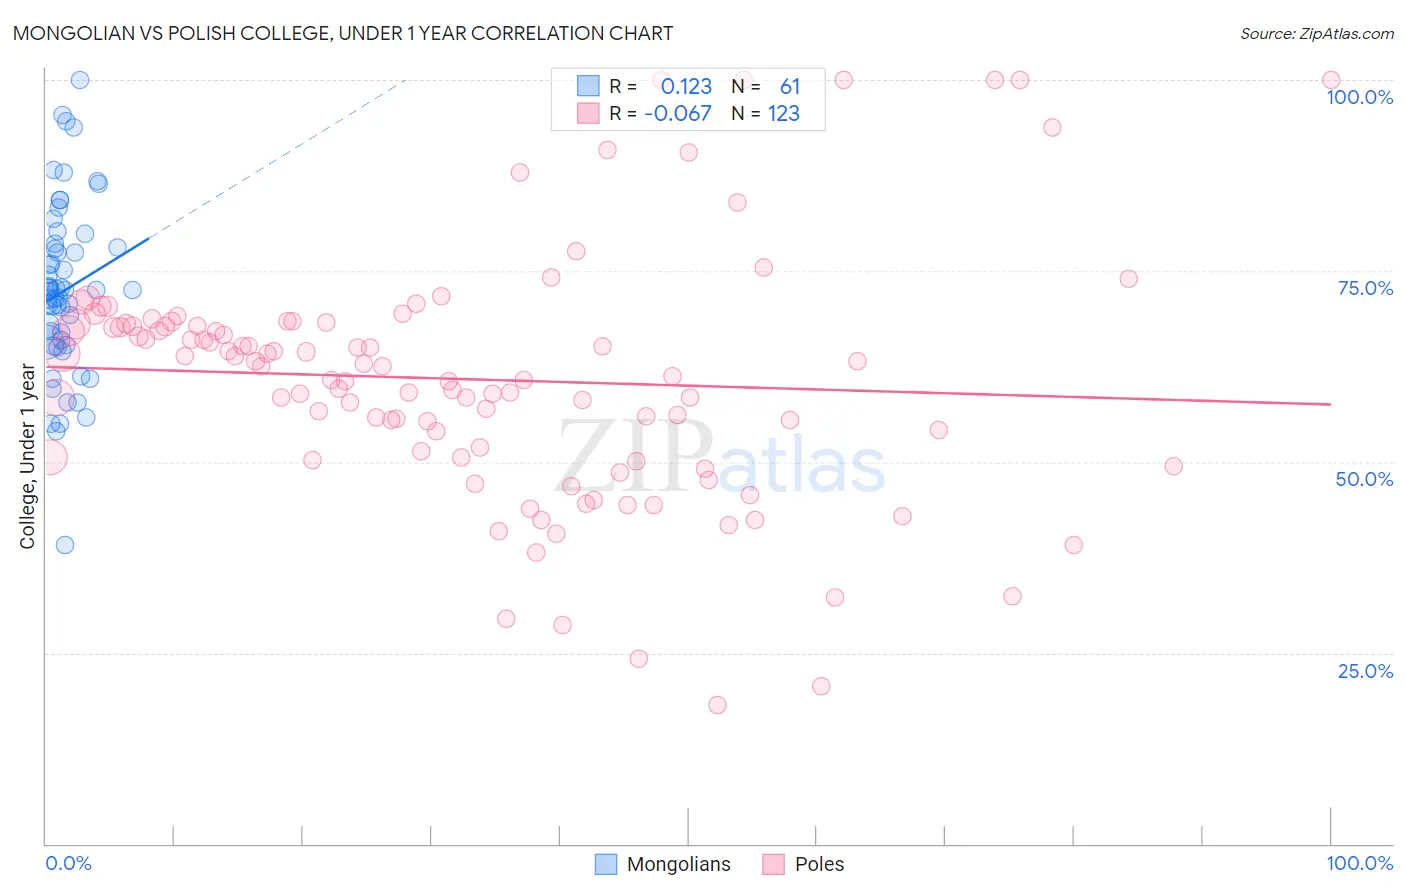
Mongolian vs Polish College, Under 1 year Correlation Chart
The statistical analysis conducted on geographies consisting of 140,362,004 people shows a poor positive correlation between the proportion of Mongolians and percentage of population with at least college, under 1 year education in the United States with a correlation coefficient (R) of 0.123 and weighted average of 69.9%. Similarly, the statistical analysis conducted on geographies consisting of 560,588,351 people shows a slight negative correlation between the proportion of Poles and percentage of population with at least college, under 1 year education in the United States with a correlation coefficient (R) of -0.067 and weighted average of 66.9%, a difference of 4.5%.
College, Under 1 year Correlation Summary
| Measurement | Mongolian | Polish |
| Minimum | 39.1% | 18.2% |
| Maximum | 100.0% | 100.0% |
| Range | 60.9% | 81.8% |
| Mean | 72.4% | 60.8% |
| Median | 72.4% | 62.5% |
| Interquartile 25% (IQ1) | 65.5% | 50.6% |
| Interquartile 75% (IQ3) | 78.3% | 68.1% |
| Interquartile Range (IQR) | 12.8% | 17.4% |
| Standard Deviation (Sample) | 11.3% | 16.0% |
| Standard Deviation (Population) | 11.2% | 15.9% |
Similar Demographics by College, Under 1 year
Demographics Similar to Mongolians by College, Under 1 year
In terms of college, under 1 year, the demographic groups most similar to Mongolians are Immigrants from Russia (69.9%, a difference of 0.020%), Zimbabwean (69.9%, a difference of 0.040%), Immigrants from Austria (70.0%, a difference of 0.15%), Immigrants from Netherlands (70.0%, a difference of 0.20%), and Immigrants from Bulgaria (70.0%, a difference of 0.25%).
| Demographics | Rating | Rank | College, Under 1 year |
| New Zealanders | 99.9 /100 | #44 | Exceptional 70.2% |
| Immigrants | Norway | 99.9 /100 | #45 | Exceptional 70.2% |
| Immigrants | Latvia | 99.9 /100 | #46 | Exceptional 70.1% |
| Immigrants | Bulgaria | 99.8 /100 | #47 | Exceptional 70.0% |
| Immigrants | Netherlands | 99.8 /100 | #48 | Exceptional 70.0% |
| Immigrants | Austria | 99.8 /100 | #49 | Exceptional 70.0% |
| Zimbabweans | 99.8 /100 | #50 | Exceptional 69.9% |
| Mongolians | 99.8 /100 | #51 | Exceptional 69.9% |
| Immigrants | Russia | 99.8 /100 | #52 | Exceptional 69.9% |
| South Africans | 99.7 /100 | #53 | Exceptional 69.7% |
| Immigrants | Czechoslovakia | 99.7 /100 | #54 | Exceptional 69.6% |
| Maltese | 99.7 /100 | #55 | Exceptional 69.5% |
| Immigrants | Scotland | 99.6 /100 | #56 | Exceptional 69.4% |
| Asians | 99.6 /100 | #57 | Exceptional 69.4% |
| Immigrants | Malaysia | 99.6 /100 | #58 | Exceptional 69.3% |
Demographics Similar to Poles by College, Under 1 year
In terms of college, under 1 year, the demographic groups most similar to Poles are Immigrants from Brazil (66.9%, a difference of 0.010%), Finnish (66.9%, a difference of 0.020%), Iraqi (66.8%, a difference of 0.050%), Immigrants from Syria (66.9%, a difference of 0.060%), and Canadian (66.8%, a difference of 0.060%).
| Demographics | Rating | Rank | College, Under 1 year |
| Italians | 91.8 /100 | #125 | Exceptional 67.2% |
| Alsatians | 91.3 /100 | #126 | Exceptional 67.1% |
| Czechs | 90.8 /100 | #127 | Exceptional 67.1% |
| Scottish | 90.2 /100 | #128 | Exceptional 67.0% |
| Immigrants | Eastern Africa | 89.5 /100 | #129 | Excellent 67.0% |
| Immigrants | Syria | 89.0 /100 | #130 | Excellent 66.9% |
| Finns | 88.6 /100 | #131 | Excellent 66.9% |
| Poles | 88.4 /100 | #132 | Excellent 66.9% |
| Immigrants | Brazil | 88.3 /100 | #133 | Excellent 66.9% |
| Iraqis | 88.0 /100 | #134 | Excellent 66.8% |
| Canadians | 87.9 /100 | #135 | Excellent 66.8% |
| Ugandans | 87.8 /100 | #136 | Excellent 66.8% |
| Immigrants | Chile | 87.4 /100 | #137 | Excellent 66.8% |
| Immigrants | Italy | 86.9 /100 | #138 | Excellent 66.8% |
| Venezuelans | 85.9 /100 | #139 | Excellent 66.7% |