Finnish vs Polish College, Under 1 year
COMPARE
Finnish
Polish
College, Under 1 year
College, Under 1 year Comparison
Finns
Poles
66.9%
COLLEGE, UNDER 1 YEAR
88.6/ 100
METRIC RATING
131st/ 347
METRIC RANK
66.9%
COLLEGE, UNDER 1 YEAR
88.4/ 100
METRIC RATING
132nd/ 347
METRIC RANK
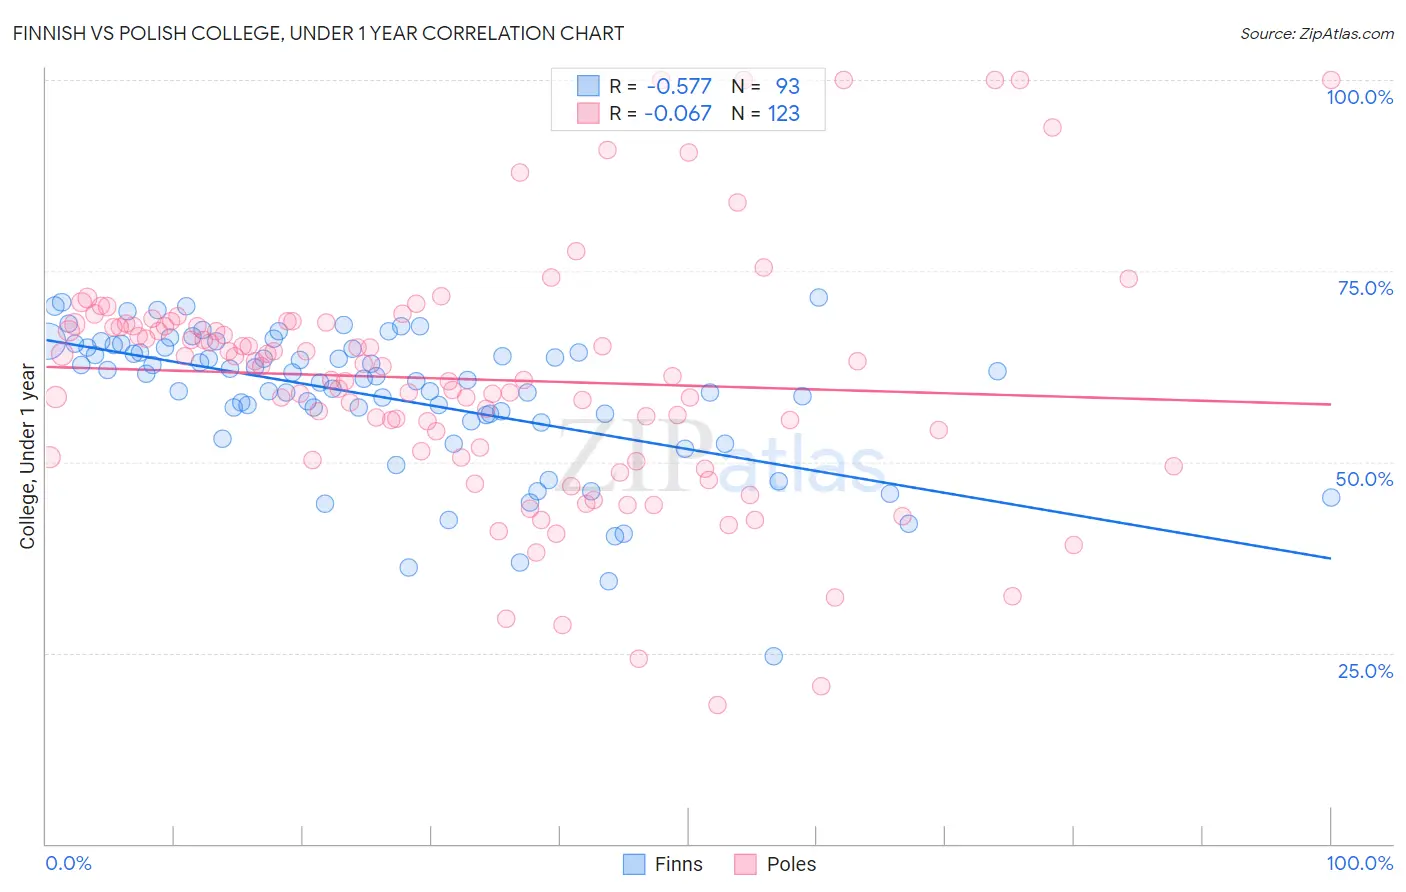
Finnish vs Polish College, Under 1 year Correlation Chart
The statistical analysis conducted on geographies consisting of 404,673,530 people shows a substantial negative correlation between the proportion of Finns and percentage of population with at least college, under 1 year education in the United States with a correlation coefficient (R) of -0.577 and weighted average of 66.9%. Similarly, the statistical analysis conducted on geographies consisting of 560,588,351 people shows a slight negative correlation between the proportion of Poles and percentage of population with at least college, under 1 year education in the United States with a correlation coefficient (R) of -0.067 and weighted average of 66.9%, a difference of 0.020%.
College, Under 1 year Correlation Summary
| Measurement | Finnish | Polish |
| Minimum | 24.5% | 18.2% |
| Maximum | 71.6% | 100.0% |
| Range | 47.0% | 81.8% |
| Mean | 58.5% | 60.8% |
| Median | 60.9% | 62.5% |
| Interquartile 25% (IQ1) | 55.8% | 50.6% |
| Interquartile 75% (IQ3) | 64.9% | 68.1% |
| Interquartile Range (IQR) | 9.1% | 17.4% |
| Standard Deviation (Sample) | 9.3% | 16.0% |
| Standard Deviation (Population) | 9.2% | 15.9% |
Demographics Similar to Finns and Poles by College, Under 1 year
In terms of college, under 1 year, the demographic groups most similar to Finns are Immigrants from Brazil (66.9%, a difference of 0.030%), Immigrants from Syria (66.9%, a difference of 0.040%), Iraqi (66.8%, a difference of 0.060%), Canadian (66.8%, a difference of 0.070%), and Ugandan (66.8%, a difference of 0.080%). Similarly, the demographic groups most similar to Poles are Immigrants from Brazil (66.9%, a difference of 0.010%), Iraqi (66.8%, a difference of 0.050%), Immigrants from Syria (66.9%, a difference of 0.060%), Canadian (66.8%, a difference of 0.060%), and Ugandan (66.8%, a difference of 0.070%).
| Demographics | Rating | Rank | College, Under 1 year |
| Slovenes | 93.3 /100 | #121 | Exceptional 67.3% |
| Immigrants | Jordan | 92.8 /100 | #122 | Exceptional 67.3% |
| Immigrants | Northern Africa | 92.7 /100 | #123 | Exceptional 67.2% |
| Arabs | 92.6 /100 | #124 | Exceptional 67.2% |
| Italians | 91.8 /100 | #125 | Exceptional 67.2% |
| Alsatians | 91.3 /100 | #126 | Exceptional 67.1% |
| Czechs | 90.8 /100 | #127 | Exceptional 67.1% |
| Scottish | 90.2 /100 | #128 | Exceptional 67.0% |
| Immigrants | Eastern Africa | 89.5 /100 | #129 | Excellent 67.0% |
| Immigrants | Syria | 89.0 /100 | #130 | Excellent 66.9% |
| Finns | 88.6 /100 | #131 | Excellent 66.9% |
| Poles | 88.4 /100 | #132 | Excellent 66.9% |
| Immigrants | Brazil | 88.3 /100 | #133 | Excellent 66.9% |
| Iraqis | 88.0 /100 | #134 | Excellent 66.8% |
| Canadians | 87.9 /100 | #135 | Excellent 66.8% |
| Ugandans | 87.8 /100 | #136 | Excellent 66.8% |
| Immigrants | Chile | 87.4 /100 | #137 | Excellent 66.8% |
| Immigrants | Italy | 86.9 /100 | #138 | Excellent 66.8% |
| Venezuelans | 85.9 /100 | #139 | Excellent 66.7% |
| Slavs | 85.9 /100 | #140 | Excellent 66.7% |
| Immigrants | Afghanistan | 85.1 /100 | #141 | Excellent 66.7% |