Haitian vs Immigrants from Netherlands College, 1 year or more
COMPARE
Haitian
Immigrants from Netherlands
College, 1 year or more
College, 1 year or more Comparison
Haitians
Immigrants from Netherlands
52.3%
COLLEGE, 1 YEAR OR MORE
0.0/ 100
METRIC RATING
301st/ 347
METRIC RANK
64.2%
COLLEGE, 1 YEAR OR MORE
99.8/ 100
METRIC RATING
52nd/ 347
METRIC RANK
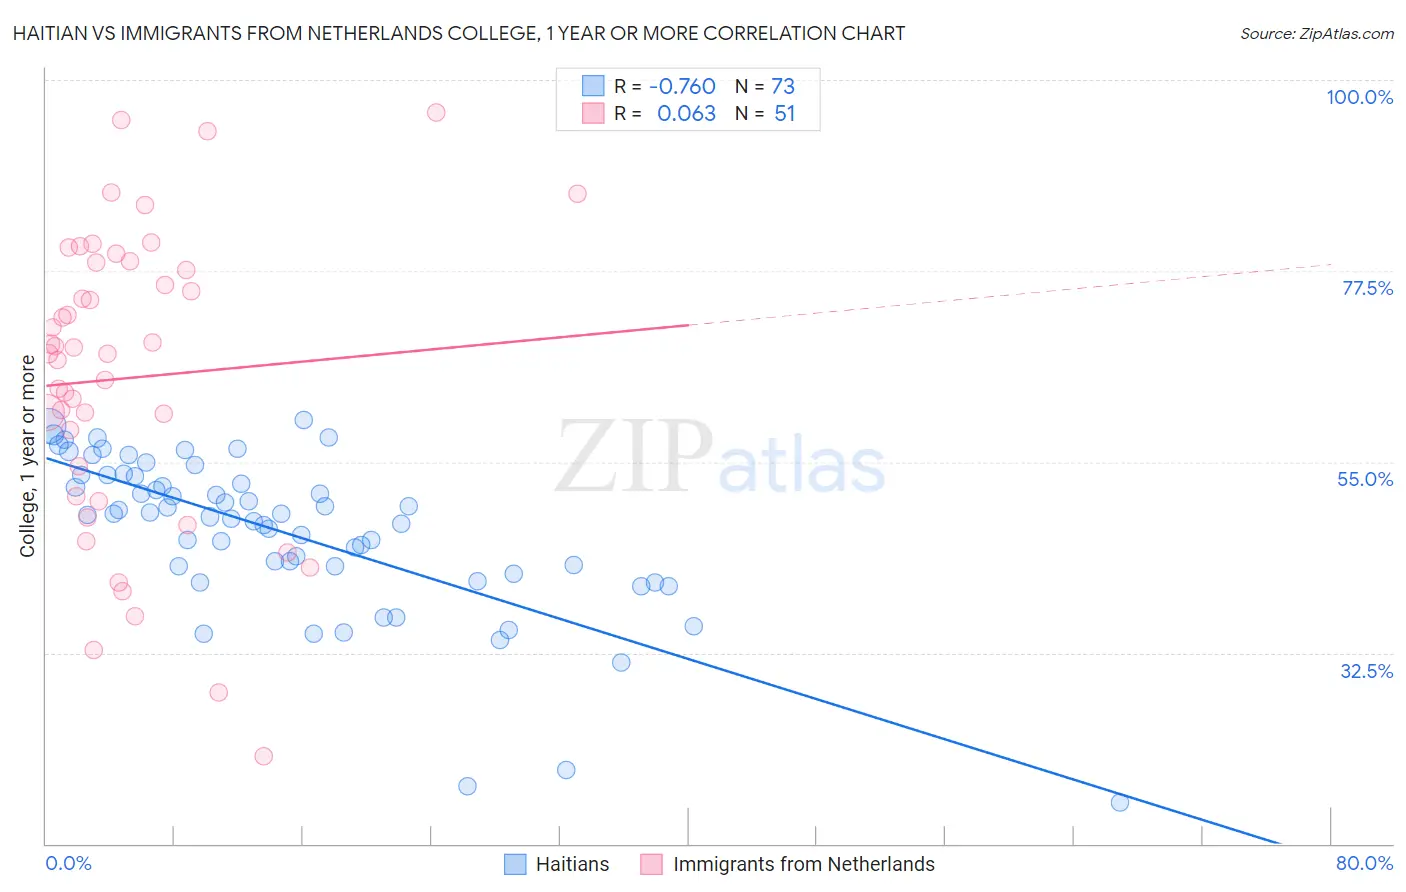
Haitian vs Immigrants from Netherlands College, 1 year or more Correlation Chart
The statistical analysis conducted on geographies consisting of 288,015,465 people shows a strong negative correlation between the proportion of Haitians and percentage of population with at least college, 1 year or more education in the United States with a correlation coefficient (R) of -0.760 and weighted average of 52.3%. Similarly, the statistical analysis conducted on geographies consisting of 237,877,405 people shows a slight positive correlation between the proportion of Immigrants from Netherlands and percentage of population with at least college, 1 year or more education in the United States with a correlation coefficient (R) of 0.063 and weighted average of 64.2%, a difference of 22.8%.
College, 1 year or more Correlation Summary
| Measurement | Haitian | Immigrants from Netherlands |
| Minimum | 14.8% | 20.3% |
| Maximum | 59.9% | 96.1% |
| Range | 45.1% | 75.8% |
| Mean | 46.6% | 64.9% |
| Median | 48.7% | 67.8% |
| Interquartile 25% (IQ1) | 42.3% | 51.0% |
| Interquartile 75% (IQ3) | 53.4% | 78.5% |
| Interquartile Range (IQR) | 11.1% | 27.5% |
| Standard Deviation (Sample) | 9.4% | 17.5% |
| Standard Deviation (Population) | 9.3% | 17.3% |
Similar Demographics by College, 1 year or more
Demographics Similar to Haitians by College, 1 year or more
In terms of college, 1 year or more, the demographic groups most similar to Haitians are Choctaw (52.3%, a difference of 0.060%), Immigrants from Nicaragua (52.4%, a difference of 0.10%), Puerto Rican (52.2%, a difference of 0.13%), Creek (52.2%, a difference of 0.21%), and Central American (52.1%, a difference of 0.34%).
| Demographics | Rating | Rank | College, 1 year or more |
| Cherokee | 0.0 /100 | #294 | Tragic 53.2% |
| Yaqui | 0.0 /100 | #295 | Tragic 53.2% |
| Sioux | 0.0 /100 | #296 | Tragic 53.0% |
| Paiute | 0.0 /100 | #297 | Tragic 52.9% |
| Immigrants | Dominica | 0.0 /100 | #298 | Tragic 52.5% |
| Immigrants | Nicaragua | 0.0 /100 | #299 | Tragic 52.4% |
| Choctaw | 0.0 /100 | #300 | Tragic 52.3% |
| Haitians | 0.0 /100 | #301 | Tragic 52.3% |
| Puerto Ricans | 0.0 /100 | #302 | Tragic 52.2% |
| Creek | 0.0 /100 | #303 | Tragic 52.2% |
| Central Americans | 0.0 /100 | #304 | Tragic 52.1% |
| Seminole | 0.0 /100 | #305 | Tragic 52.1% |
| Mexican American Indians | 0.0 /100 | #306 | Tragic 51.9% |
| Immigrants | Portugal | 0.0 /100 | #307 | Tragic 51.9% |
| Salvadorans | 0.0 /100 | #308 | Tragic 51.8% |
Demographics Similar to Immigrants from Netherlands by College, 1 year or more
In terms of college, 1 year or more, the demographic groups most similar to Immigrants from Netherlands are Asian (64.2%, a difference of 0.020%), Zimbabwean (64.2%, a difference of 0.050%), Immigrants from Malaysia (64.3%, a difference of 0.16%), Immigrants from Belarus (64.1%, a difference of 0.17%), and Immigrants from Czechoslovakia (64.1%, a difference of 0.20%).
| Demographics | Rating | Rank | College, 1 year or more |
| Immigrants | Lithuania | 99.9 /100 | #45 | Exceptional 64.6% |
| Bhutanese | 99.9 /100 | #46 | Exceptional 64.6% |
| Australians | 99.9 /100 | #47 | Exceptional 64.6% |
| Immigrants | Bulgaria | 99.9 /100 | #48 | Exceptional 64.6% |
| New Zealanders | 99.9 /100 | #49 | Exceptional 64.6% |
| Immigrants | Austria | 99.8 /100 | #50 | Exceptional 64.4% |
| Immigrants | Malaysia | 99.8 /100 | #51 | Exceptional 64.3% |
| Immigrants | Netherlands | 99.8 /100 | #52 | Exceptional 64.2% |
| Asians | 99.8 /100 | #53 | Exceptional 64.2% |
| Zimbabweans | 99.8 /100 | #54 | Exceptional 64.2% |
| Immigrants | Belarus | 99.7 /100 | #55 | Exceptional 64.1% |
| Immigrants | Czechoslovakia | 99.7 /100 | #56 | Exceptional 64.1% |
| South Africans | 99.7 /100 | #57 | Exceptional 64.1% |
| Immigrants | Asia | 99.7 /100 | #58 | Exceptional 64.0% |
| Immigrants | Serbia | 99.6 /100 | #59 | Exceptional 63.8% |