Haitian vs Scottish College, 1 year or more
COMPARE
Haitian
Scottish
College, 1 year or more
College, 1 year or more Comparison
Haitians
Scottish
52.3%
COLLEGE, 1 YEAR OR MORE
0.0/ 100
METRIC RATING
301st/ 347
METRIC RANK
60.5%
COLLEGE, 1 YEAR OR MORE
80.2/ 100
METRIC RATING
146th/ 347
METRIC RANK
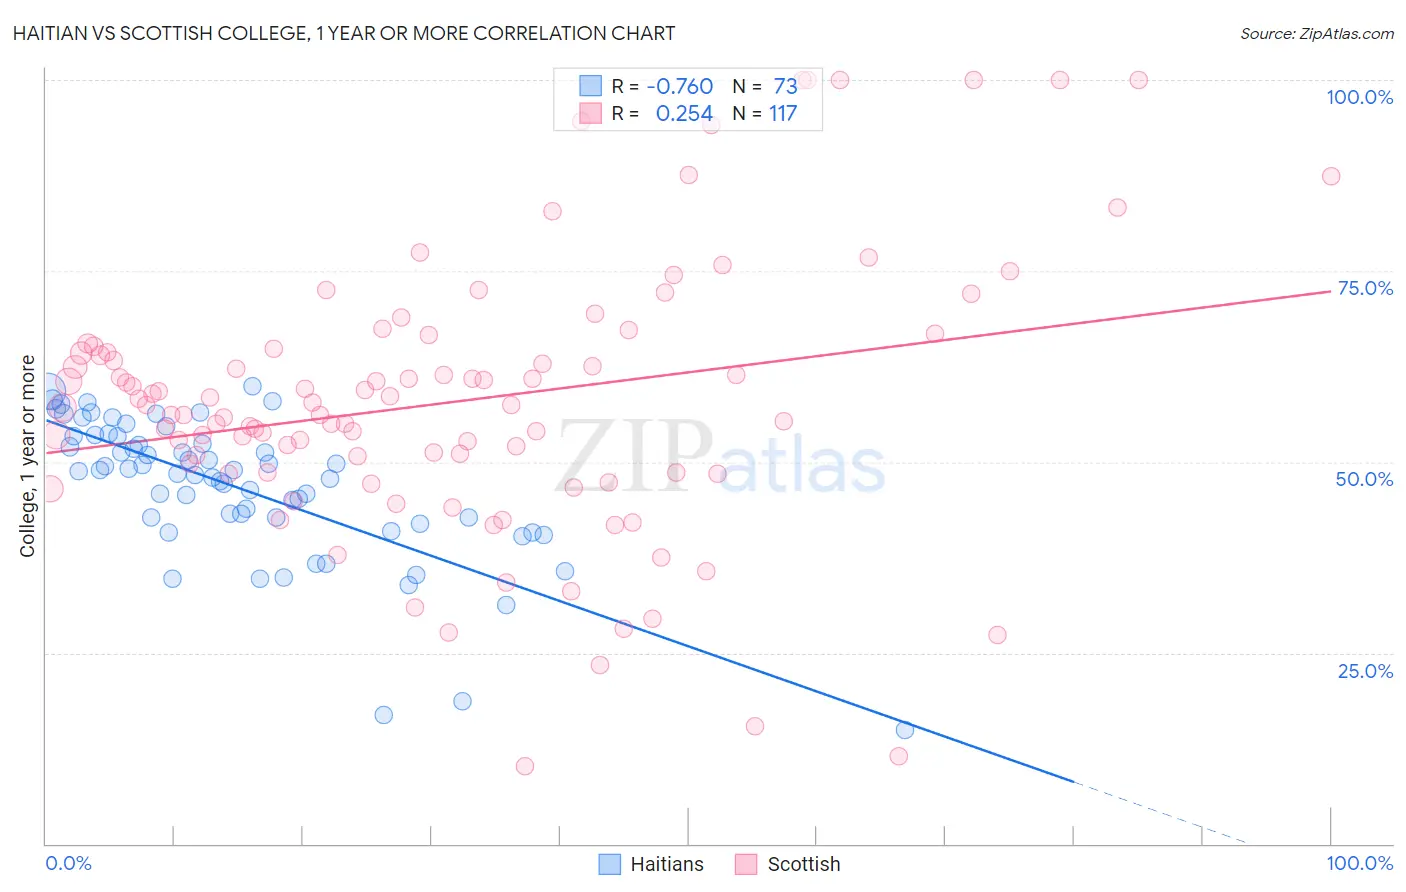
Haitian vs Scottish College, 1 year or more Correlation Chart
The statistical analysis conducted on geographies consisting of 288,015,465 people shows a strong negative correlation between the proportion of Haitians and percentage of population with at least college, 1 year or more education in the United States with a correlation coefficient (R) of -0.760 and weighted average of 52.3%. Similarly, the statistical analysis conducted on geographies consisting of 567,133,506 people shows a weak positive correlation between the proportion of Scottish and percentage of population with at least college, 1 year or more education in the United States with a correlation coefficient (R) of 0.254 and weighted average of 60.5%, a difference of 15.7%.
College, 1 year or more Correlation Summary
| Measurement | Haitian | Scottish |
| Minimum | 14.8% | 10.1% |
| Maximum | 59.9% | 100.0% |
| Range | 45.1% | 89.9% |
| Mean | 46.6% | 57.9% |
| Median | 48.7% | 57.5% |
| Interquartile 25% (IQ1) | 42.3% | 48.7% |
| Interquartile 75% (IQ3) | 53.4% | 65.0% |
| Interquartile Range (IQR) | 11.1% | 16.3% |
| Standard Deviation (Sample) | 9.4% | 17.9% |
| Standard Deviation (Population) | 9.3% | 17.8% |
Similar Demographics by College, 1 year or more
Demographics Similar to Haitians by College, 1 year or more
In terms of college, 1 year or more, the demographic groups most similar to Haitians are Choctaw (52.3%, a difference of 0.060%), Immigrants from Nicaragua (52.4%, a difference of 0.10%), Puerto Rican (52.2%, a difference of 0.13%), Creek (52.2%, a difference of 0.21%), and Central American (52.1%, a difference of 0.34%).
| Demographics | Rating | Rank | College, 1 year or more |
| Cherokee | 0.0 /100 | #294 | Tragic 53.2% |
| Yaqui | 0.0 /100 | #295 | Tragic 53.2% |
| Sioux | 0.0 /100 | #296 | Tragic 53.0% |
| Paiute | 0.0 /100 | #297 | Tragic 52.9% |
| Immigrants | Dominica | 0.0 /100 | #298 | Tragic 52.5% |
| Immigrants | Nicaragua | 0.0 /100 | #299 | Tragic 52.4% |
| Choctaw | 0.0 /100 | #300 | Tragic 52.3% |
| Haitians | 0.0 /100 | #301 | Tragic 52.3% |
| Puerto Ricans | 0.0 /100 | #302 | Tragic 52.2% |
| Creek | 0.0 /100 | #303 | Tragic 52.2% |
| Central Americans | 0.0 /100 | #304 | Tragic 52.1% |
| Seminole | 0.0 /100 | #305 | Tragic 52.1% |
| Mexican American Indians | 0.0 /100 | #306 | Tragic 51.9% |
| Immigrants | Portugal | 0.0 /100 | #307 | Tragic 51.9% |
| Salvadorans | 0.0 /100 | #308 | Tragic 51.8% |
Demographics Similar to Scottish by College, 1 year or more
In terms of college, 1 year or more, the demographic groups most similar to Scottish are Slavic (60.6%, a difference of 0.070%), Immigrants from Kenya (60.5%, a difference of 0.090%), Kenyan (60.5%, a difference of 0.10%), Brazilian (60.5%, a difference of 0.10%), and Czech (60.6%, a difference of 0.14%).
| Demographics | Rating | Rank | College, 1 year or more |
| Immigrants | Eritrea | 84.3 /100 | #139 | Excellent 60.7% |
| Iraqis | 83.3 /100 | #140 | Excellent 60.7% |
| Immigrants | Afghanistan | 83.1 /100 | #141 | Excellent 60.7% |
| Poles | 82.8 /100 | #142 | Excellent 60.7% |
| Canadians | 82.7 /100 | #143 | Excellent 60.6% |
| Czechs | 81.9 /100 | #144 | Excellent 60.6% |
| Slavs | 81.1 /100 | #145 | Excellent 60.6% |
| Scottish | 80.2 /100 | #146 | Excellent 60.5% |
| Immigrants | Kenya | 79.1 /100 | #147 | Good 60.5% |
| Kenyans | 79.0 /100 | #148 | Good 60.5% |
| Brazilians | 79.0 /100 | #149 | Good 60.5% |
| Immigrants | Sudan | 77.8 /100 | #150 | Good 60.4% |
| Albanians | 77.8 /100 | #151 | Good 60.4% |
| Immigrants | Germany | 76.1 /100 | #152 | Good 60.3% |
| Sierra Leoneans | 74.1 /100 | #153 | Good 60.2% |