Immigrants from Scotland vs Immigrants from Netherlands College, 1 year or more
COMPARE
Immigrants from Scotland
Immigrants from Netherlands
College, 1 year or more
College, 1 year or more Comparison
Immigrants from Scotland
Immigrants from Netherlands
63.4%
COLLEGE, 1 YEAR OR MORE
99.4/ 100
METRIC RATING
63rd/ 347
METRIC RANK
64.2%
COLLEGE, 1 YEAR OR MORE
99.8/ 100
METRIC RATING
52nd/ 347
METRIC RANK
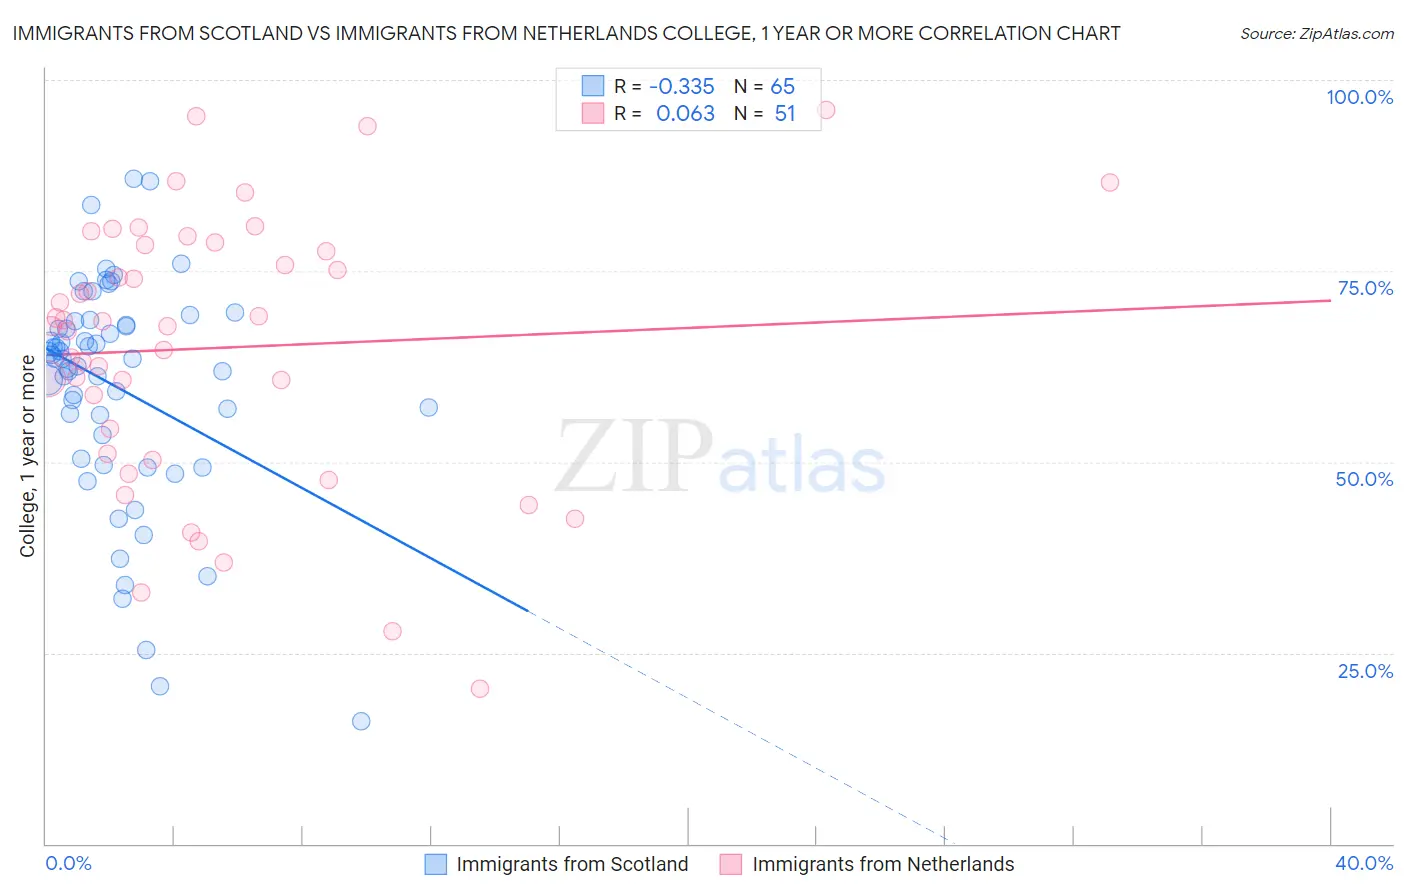
Immigrants from Scotland vs Immigrants from Netherlands College, 1 year or more Correlation Chart
The statistical analysis conducted on geographies consisting of 196,397,263 people shows a mild negative correlation between the proportion of Immigrants from Scotland and percentage of population with at least college, 1 year or more education in the United States with a correlation coefficient (R) of -0.335 and weighted average of 63.4%. Similarly, the statistical analysis conducted on geographies consisting of 237,877,405 people shows a slight positive correlation between the proportion of Immigrants from Netherlands and percentage of population with at least college, 1 year or more education in the United States with a correlation coefficient (R) of 0.063 and weighted average of 64.2%, a difference of 1.2%.
College, 1 year or more Correlation Summary
| Measurement | Immigrants from Scotland | Immigrants from Netherlands |
| Minimum | 16.1% | 20.3% |
| Maximum | 87.1% | 96.1% |
| Range | 71.0% | 75.8% |
| Mean | 59.8% | 64.9% |
| Median | 63.6% | 67.8% |
| Interquartile 25% (IQ1) | 51.9% | 51.0% |
| Interquartile 75% (IQ3) | 68.2% | 78.5% |
| Interquartile Range (IQR) | 16.3% | 27.5% |
| Standard Deviation (Sample) | 14.6% | 17.5% |
| Standard Deviation (Population) | 14.5% | 17.3% |
Demographics Similar to Immigrants from Scotland and Immigrants from Netherlands by College, 1 year or more
In terms of college, 1 year or more, the demographic groups most similar to Immigrants from Scotland are Immigrants from Spain (63.4%, a difference of 0.030%), Immigrants from Indonesia (63.5%, a difference of 0.13%), Maltese (63.4%, a difference of 0.13%), Bolivian (63.5%, a difference of 0.14%), and Immigrants from Europe (63.3%, a difference of 0.24%). Similarly, the demographic groups most similar to Immigrants from Netherlands are Asian (64.2%, a difference of 0.020%), Zimbabwean (64.2%, a difference of 0.050%), Immigrants from Malaysia (64.3%, a difference of 0.16%), Immigrants from Belarus (64.1%, a difference of 0.17%), and Immigrants from Czechoslovakia (64.1%, a difference of 0.20%).
| Demographics | Rating | Rank | College, 1 year or more |
| Australians | 99.9 /100 | #47 | Exceptional 64.6% |
| Immigrants | Bulgaria | 99.9 /100 | #48 | Exceptional 64.6% |
| New Zealanders | 99.9 /100 | #49 | Exceptional 64.6% |
| Immigrants | Austria | 99.8 /100 | #50 | Exceptional 64.4% |
| Immigrants | Malaysia | 99.8 /100 | #51 | Exceptional 64.3% |
| Immigrants | Netherlands | 99.8 /100 | #52 | Exceptional 64.2% |
| Asians | 99.8 /100 | #53 | Exceptional 64.2% |
| Zimbabweans | 99.8 /100 | #54 | Exceptional 64.2% |
| Immigrants | Belarus | 99.7 /100 | #55 | Exceptional 64.1% |
| Immigrants | Czechoslovakia | 99.7 /100 | #56 | Exceptional 64.1% |
| South Africans | 99.7 /100 | #57 | Exceptional 64.1% |
| Immigrants | Asia | 99.7 /100 | #58 | Exceptional 64.0% |
| Immigrants | Serbia | 99.6 /100 | #59 | Exceptional 63.8% |
| Immigrants | Kazakhstan | 99.5 /100 | #60 | Exceptional 63.6% |
| Bolivians | 99.5 /100 | #61 | Exceptional 63.5% |
| Immigrants | Indonesia | 99.5 /100 | #62 | Exceptional 63.5% |
| Immigrants | Scotland | 99.4 /100 | #63 | Exceptional 63.4% |
| Immigrants | Spain | 99.4 /100 | #64 | Exceptional 63.4% |
| Maltese | 99.3 /100 | #65 | Exceptional 63.4% |
| Immigrants | Europe | 99.3 /100 | #66 | Exceptional 63.3% |
| Immigrants | Romania | 99.3 /100 | #67 | Exceptional 63.3% |