Haitian vs Immigrants from Northern Africa College, 1 year or more
COMPARE
Haitian
Immigrants from Northern Africa
College, 1 year or more
College, 1 year or more Comparison
Haitians
Immigrants from Northern Africa
52.3%
COLLEGE, 1 YEAR OR MORE
0.0/ 100
METRIC RATING
301st/ 347
METRIC RANK
61.9%
COLLEGE, 1 YEAR OR MORE
95.7/ 100
METRIC RATING
109th/ 347
METRIC RANK
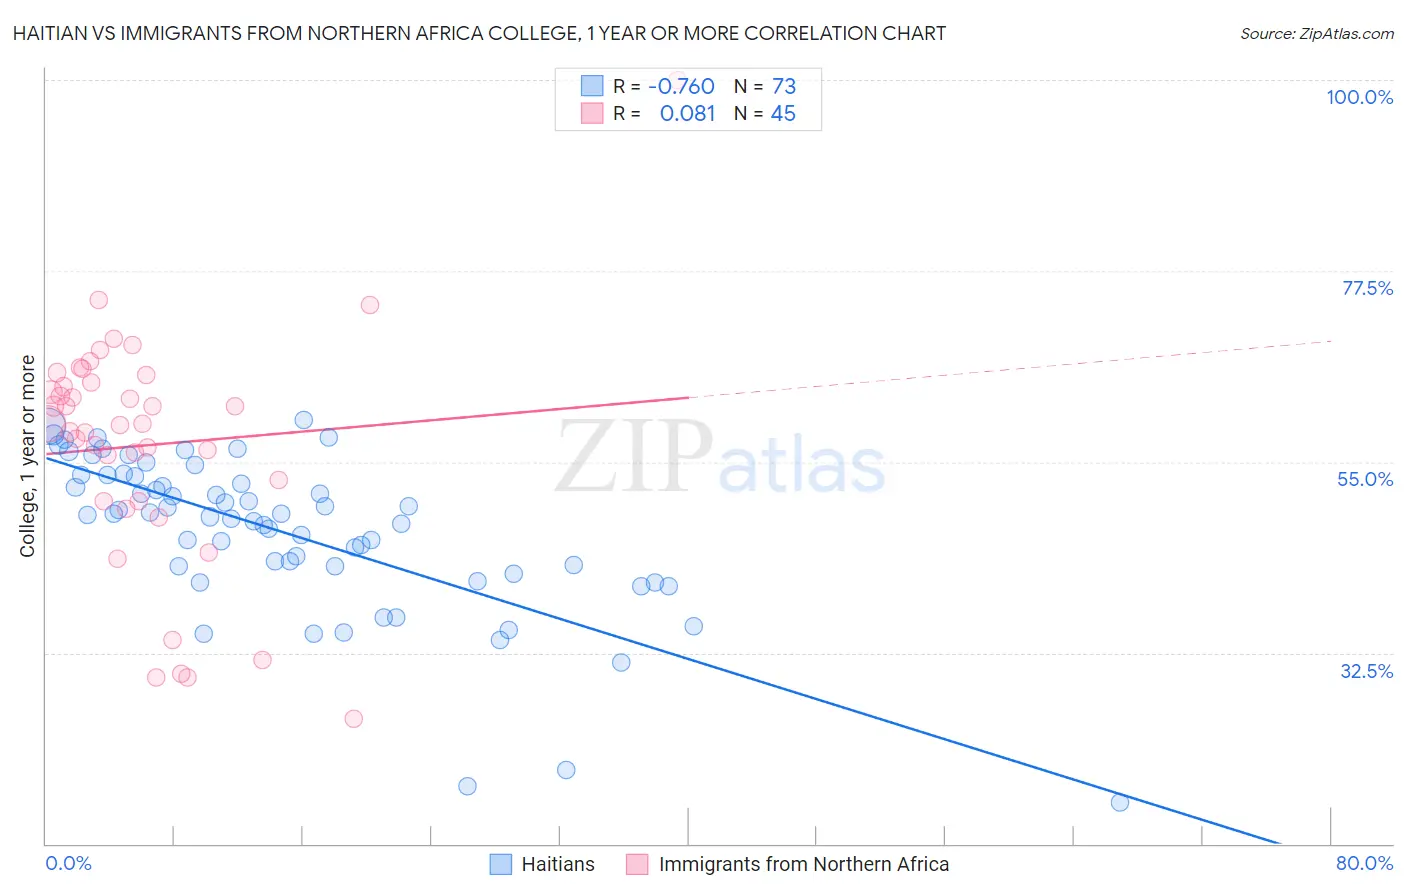
Haitian vs Immigrants from Northern Africa College, 1 year or more Correlation Chart
The statistical analysis conducted on geographies consisting of 288,015,465 people shows a strong negative correlation between the proportion of Haitians and percentage of population with at least college, 1 year or more education in the United States with a correlation coefficient (R) of -0.760 and weighted average of 52.3%. Similarly, the statistical analysis conducted on geographies consisting of 321,198,131 people shows a slight positive correlation between the proportion of Immigrants from Northern Africa and percentage of population with at least college, 1 year or more education in the United States with a correlation coefficient (R) of 0.081 and weighted average of 61.9%, a difference of 18.2%.
College, 1 year or more Correlation Summary
| Measurement | Haitian | Immigrants from Northern Africa |
| Minimum | 14.8% | 24.8% |
| Maximum | 59.9% | 100.0% |
| Range | 45.1% | 75.2% |
| Mean | 46.6% | 57.0% |
| Median | 48.7% | 59.4% |
| Interquartile 25% (IQ1) | 42.3% | 50.4% |
| Interquartile 75% (IQ3) | 53.4% | 64.8% |
| Interquartile Range (IQR) | 11.1% | 14.4% |
| Standard Deviation (Sample) | 9.4% | 14.0% |
| Standard Deviation (Population) | 9.3% | 13.8% |
Similar Demographics by College, 1 year or more
Demographics Similar to Haitians by College, 1 year or more
In terms of college, 1 year or more, the demographic groups most similar to Haitians are Choctaw (52.3%, a difference of 0.060%), Immigrants from Nicaragua (52.4%, a difference of 0.10%), Puerto Rican (52.2%, a difference of 0.13%), Creek (52.2%, a difference of 0.21%), and Central American (52.1%, a difference of 0.34%).
| Demographics | Rating | Rank | College, 1 year or more |
| Cherokee | 0.0 /100 | #294 | Tragic 53.2% |
| Yaqui | 0.0 /100 | #295 | Tragic 53.2% |
| Sioux | 0.0 /100 | #296 | Tragic 53.0% |
| Paiute | 0.0 /100 | #297 | Tragic 52.9% |
| Immigrants | Dominica | 0.0 /100 | #298 | Tragic 52.5% |
| Immigrants | Nicaragua | 0.0 /100 | #299 | Tragic 52.4% |
| Choctaw | 0.0 /100 | #300 | Tragic 52.3% |
| Haitians | 0.0 /100 | #301 | Tragic 52.3% |
| Puerto Ricans | 0.0 /100 | #302 | Tragic 52.2% |
| Creek | 0.0 /100 | #303 | Tragic 52.2% |
| Central Americans | 0.0 /100 | #304 | Tragic 52.1% |
| Seminole | 0.0 /100 | #305 | Tragic 52.1% |
| Mexican American Indians | 0.0 /100 | #306 | Tragic 51.9% |
| Immigrants | Portugal | 0.0 /100 | #307 | Tragic 51.9% |
| Salvadorans | 0.0 /100 | #308 | Tragic 51.8% |
Demographics Similar to Immigrants from Northern Africa by College, 1 year or more
In terms of college, 1 year or more, the demographic groups most similar to Immigrants from Northern Africa are Syrian (61.9%, a difference of 0.0%), Immigrants from Ukraine (61.9%, a difference of 0.020%), European (61.8%, a difference of 0.020%), Macedonian (61.8%, a difference of 0.020%), and Austrian (61.8%, a difference of 0.080%).
| Demographics | Rating | Rank | College, 1 year or more |
| Luxembourgers | 96.7 /100 | #102 | Exceptional 62.1% |
| Afghans | 96.4 /100 | #103 | Exceptional 62.0% |
| Chileans | 96.4 /100 | #104 | Exceptional 62.0% |
| Immigrants | Nepal | 96.3 /100 | #105 | Exceptional 62.0% |
| Palestinians | 96.3 /100 | #106 | Exceptional 62.0% |
| Immigrants | Ukraine | 95.8 /100 | #107 | Exceptional 61.9% |
| Syrians | 95.7 /100 | #108 | Exceptional 61.9% |
| Immigrants | Northern Africa | 95.7 /100 | #109 | Exceptional 61.9% |
| Europeans | 95.6 /100 | #110 | Exceptional 61.8% |
| Macedonians | 95.6 /100 | #111 | Exceptional 61.8% |
| Austrians | 95.4 /100 | #112 | Exceptional 61.8% |
| Ukrainians | 95.2 /100 | #113 | Exceptional 61.8% |
| Danes | 94.8 /100 | #114 | Exceptional 61.7% |
| Norwegians | 94.5 /100 | #115 | Exceptional 61.7% |
| Lebanese | 94.1 /100 | #116 | Exceptional 61.6% |