Haitian vs Immigrants from Uganda College, 1 year or more
COMPARE
Haitian
Immigrants from Uganda
College, 1 year or more
College, 1 year or more Comparison
Haitians
Immigrants from Uganda
52.3%
COLLEGE, 1 YEAR OR MORE
0.0/ 100
METRIC RATING
301st/ 347
METRIC RANK
60.9%
COLLEGE, 1 YEAR OR MORE
87.4/ 100
METRIC RATING
135th/ 347
METRIC RANK
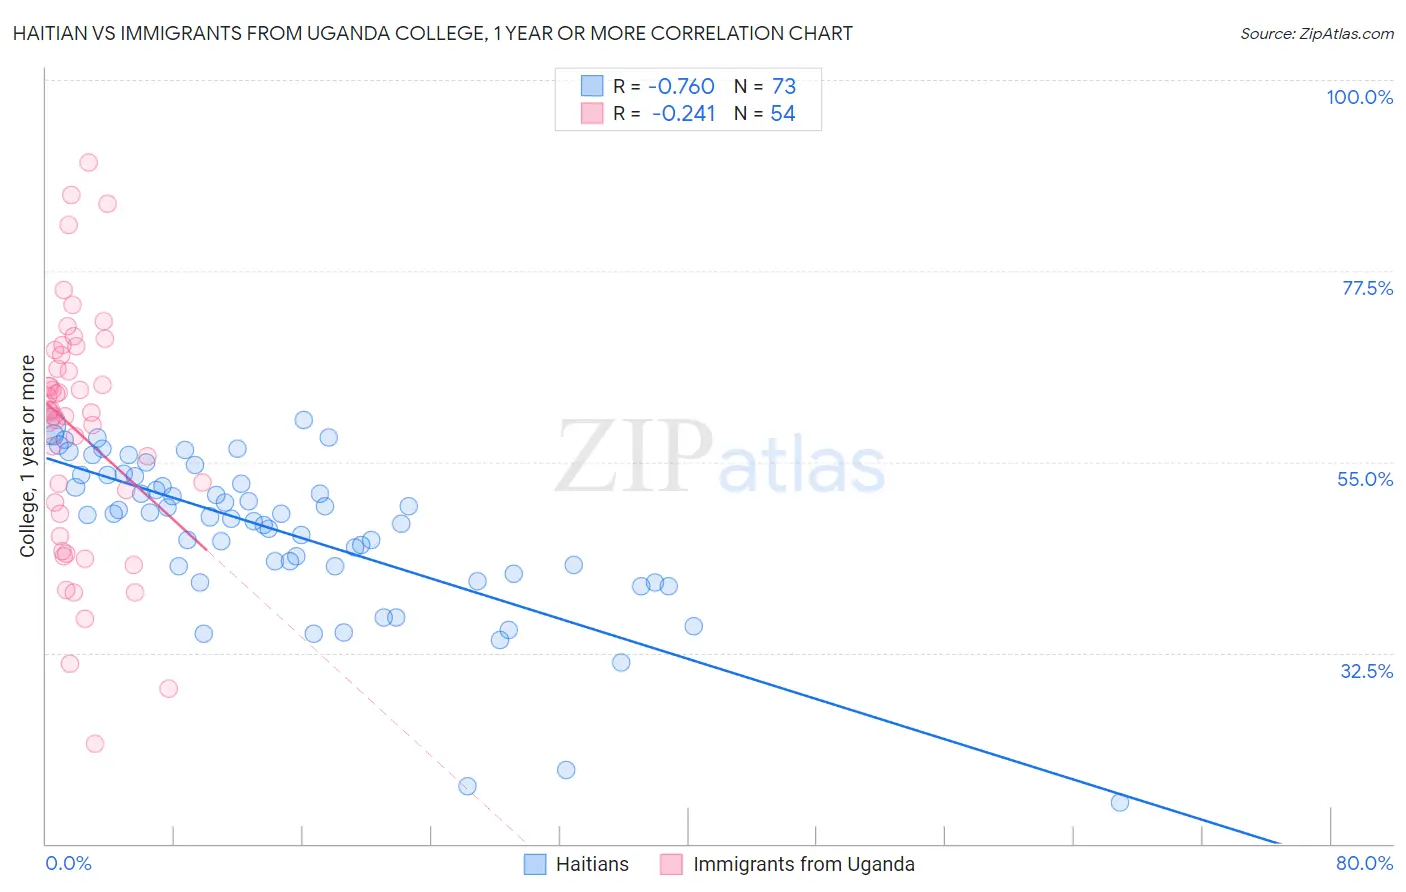
Haitian vs Immigrants from Uganda College, 1 year or more Correlation Chart
The statistical analysis conducted on geographies consisting of 288,015,465 people shows a strong negative correlation between the proportion of Haitians and percentage of population with at least college, 1 year or more education in the United States with a correlation coefficient (R) of -0.760 and weighted average of 52.3%. Similarly, the statistical analysis conducted on geographies consisting of 125,982,535 people shows a weak negative correlation between the proportion of Immigrants from Uganda and percentage of population with at least college, 1 year or more education in the United States with a correlation coefficient (R) of -0.241 and weighted average of 60.9%, a difference of 16.5%.
College, 1 year or more Correlation Summary
| Measurement | Haitian | Immigrants from Uganda |
| Minimum | 14.8% | 21.7% |
| Maximum | 59.9% | 90.3% |
| Range | 45.1% | 68.6% |
| Mean | 46.6% | 58.5% |
| Median | 48.7% | 60.9% |
| Interquartile 25% (IQ1) | 42.3% | 48.9% |
| Interquartile 75% (IQ3) | 53.4% | 67.6% |
| Interquartile Range (IQR) | 11.1% | 18.7% |
| Standard Deviation (Sample) | 9.4% | 14.4% |
| Standard Deviation (Population) | 9.3% | 14.3% |
Similar Demographics by College, 1 year or more
Demographics Similar to Haitians by College, 1 year or more
In terms of college, 1 year or more, the demographic groups most similar to Haitians are Choctaw (52.3%, a difference of 0.060%), Immigrants from Nicaragua (52.4%, a difference of 0.10%), Puerto Rican (52.2%, a difference of 0.13%), Creek (52.2%, a difference of 0.21%), and Central American (52.1%, a difference of 0.34%).
| Demographics | Rating | Rank | College, 1 year or more |
| Cherokee | 0.0 /100 | #294 | Tragic 53.2% |
| Yaqui | 0.0 /100 | #295 | Tragic 53.2% |
| Sioux | 0.0 /100 | #296 | Tragic 53.0% |
| Paiute | 0.0 /100 | #297 | Tragic 52.9% |
| Immigrants | Dominica | 0.0 /100 | #298 | Tragic 52.5% |
| Immigrants | Nicaragua | 0.0 /100 | #299 | Tragic 52.4% |
| Choctaw | 0.0 /100 | #300 | Tragic 52.3% |
| Haitians | 0.0 /100 | #301 | Tragic 52.3% |
| Puerto Ricans | 0.0 /100 | #302 | Tragic 52.2% |
| Creek | 0.0 /100 | #303 | Tragic 52.2% |
| Central Americans | 0.0 /100 | #304 | Tragic 52.1% |
| Seminole | 0.0 /100 | #305 | Tragic 52.1% |
| Mexican American Indians | 0.0 /100 | #306 | Tragic 51.9% |
| Immigrants | Portugal | 0.0 /100 | #307 | Tragic 51.9% |
| Salvadorans | 0.0 /100 | #308 | Tragic 51.8% |
Demographics Similar to Immigrants from Uganda by College, 1 year or more
In terms of college, 1 year or more, the demographic groups most similar to Immigrants from Uganda are Basque (60.9%, a difference of 0.020%), Immigrants from Venezuela (61.0%, a difference of 0.060%), Immigrants from Uzbekistan (61.0%, a difference of 0.070%), Scandinavian (61.0%, a difference of 0.10%), and Slovene (60.9%, a difference of 0.11%).
| Demographics | Rating | Rank | College, 1 year or more |
| Immigrants | Italy | 91.1 /100 | #128 | Exceptional 61.2% |
| Ugandans | 90.7 /100 | #129 | Exceptional 61.2% |
| Italians | 89.5 /100 | #130 | Excellent 61.1% |
| Immigrants | Morocco | 89.5 /100 | #131 | Excellent 61.1% |
| Scandinavians | 88.2 /100 | #132 | Excellent 61.0% |
| Immigrants | Uzbekistan | 88.0 /100 | #133 | Excellent 61.0% |
| Immigrants | Venezuela | 87.9 /100 | #134 | Excellent 61.0% |
| Immigrants | Uganda | 87.4 /100 | #135 | Excellent 60.9% |
| Basques | 87.2 /100 | #136 | Excellent 60.9% |
| Slovenes | 86.5 /100 | #137 | Excellent 60.9% |
| Taiwanese | 84.3 /100 | #138 | Excellent 60.7% |
| Immigrants | Eritrea | 84.3 /100 | #139 | Excellent 60.7% |
| Iraqis | 83.3 /100 | #140 | Excellent 60.7% |
| Immigrants | Afghanistan | 83.1 /100 | #141 | Excellent 60.7% |
| Poles | 82.8 /100 | #142 | Excellent 60.7% |