British vs Immigrants from Netherlands College, 1 year or more
COMPARE
British
Immigrants from Netherlands
College, 1 year or more
College, 1 year or more Comparison
British
Immigrants from Netherlands
62.3%
COLLEGE, 1 YEAR OR MORE
97.4/ 100
METRIC RATING
95th/ 347
METRIC RANK
64.2%
COLLEGE, 1 YEAR OR MORE
99.8/ 100
METRIC RATING
52nd/ 347
METRIC RANK
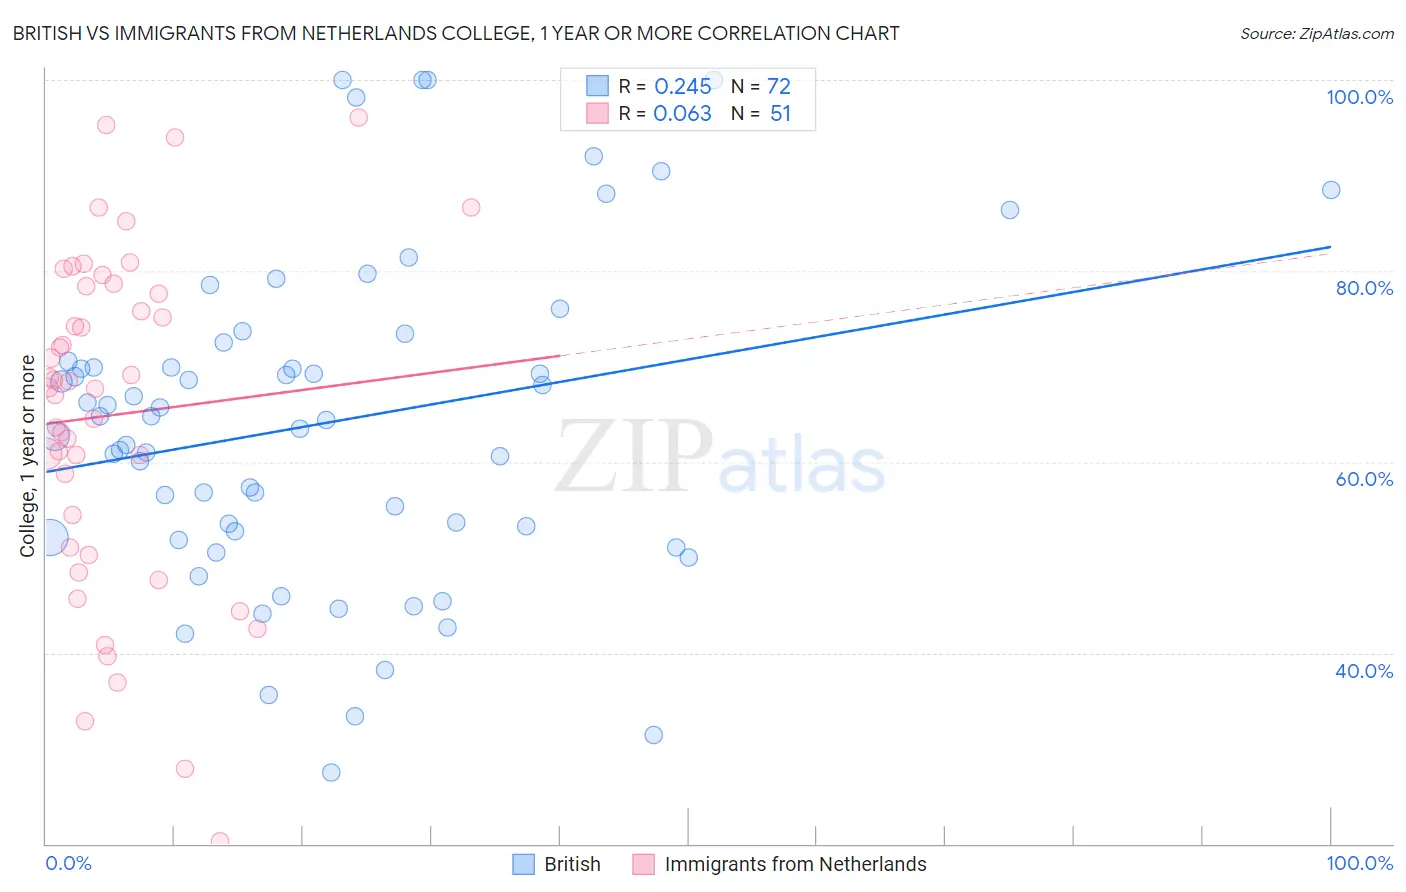
British vs Immigrants from Netherlands College, 1 year or more Correlation Chart
The statistical analysis conducted on geographies consisting of 531,458,915 people shows a weak positive correlation between the proportion of British and percentage of population with at least college, 1 year or more education in the United States with a correlation coefficient (R) of 0.245 and weighted average of 62.3%. Similarly, the statistical analysis conducted on geographies consisting of 237,877,405 people shows a slight positive correlation between the proportion of Immigrants from Netherlands and percentage of population with at least college, 1 year or more education in the United States with a correlation coefficient (R) of 0.063 and weighted average of 64.2%, a difference of 3.1%.
College, 1 year or more Correlation Summary
| Measurement | British | Immigrants from Netherlands |
| Minimum | 27.5% | 20.3% |
| Maximum | 100.0% | 96.1% |
| Range | 72.5% | 75.8% |
| Mean | 64.1% | 64.9% |
| Median | 64.6% | 67.8% |
| Interquartile 25% (IQ1) | 52.5% | 51.0% |
| Interquartile 75% (IQ3) | 71.5% | 78.5% |
| Interquartile Range (IQR) | 19.0% | 27.5% |
| Standard Deviation (Sample) | 17.1% | 17.5% |
| Standard Deviation (Population) | 17.0% | 17.3% |
Similar Demographics by College, 1 year or more
Demographics Similar to British by College, 1 year or more
In terms of college, 1 year or more, the demographic groups most similar to British are Immigrants from Croatia (62.3%, a difference of 0.10%), Chinese (62.2%, a difference of 0.12%), Jordanian (62.2%, a difference of 0.12%), Carpatho Rusyn (62.2%, a difference of 0.12%), and Croatian (62.2%, a difference of 0.13%).
| Demographics | Rating | Rank | College, 1 year or more |
| Greeks | 98.3 /100 | #88 | Exceptional 62.6% |
| Immigrants | Ethiopia | 98.2 /100 | #89 | Exceptional 62.6% |
| Immigrants | Western Asia | 97.9 /100 | #90 | Exceptional 62.5% |
| Immigrants | Eastern Europe | 97.8 /100 | #91 | Exceptional 62.4% |
| Immigrants | Egypt | 97.8 /100 | #92 | Exceptional 62.4% |
| Romanians | 97.7 /100 | #93 | Exceptional 62.4% |
| Immigrants | Croatia | 97.6 /100 | #94 | Exceptional 62.3% |
| British | 97.4 /100 | #95 | Exceptional 62.3% |
| Chinese | 97.2 /100 | #96 | Exceptional 62.2% |
| Jordanians | 97.2 /100 | #97 | Exceptional 62.2% |
| Carpatho Rusyns | 97.2 /100 | #98 | Exceptional 62.2% |
| Croatians | 97.1 /100 | #99 | Exceptional 62.2% |
| Icelanders | 96.8 /100 | #100 | Exceptional 62.1% |
| Swedes | 96.8 /100 | #101 | Exceptional 62.1% |
| Luxembourgers | 96.7 /100 | #102 | Exceptional 62.1% |
Demographics Similar to Immigrants from Netherlands by College, 1 year or more
In terms of college, 1 year or more, the demographic groups most similar to Immigrants from Netherlands are Asian (64.2%, a difference of 0.020%), Zimbabwean (64.2%, a difference of 0.050%), Immigrants from Malaysia (64.3%, a difference of 0.16%), Immigrants from Belarus (64.1%, a difference of 0.17%), and Immigrants from Czechoslovakia (64.1%, a difference of 0.20%).
| Demographics | Rating | Rank | College, 1 year or more |
| Immigrants | Lithuania | 99.9 /100 | #45 | Exceptional 64.6% |
| Bhutanese | 99.9 /100 | #46 | Exceptional 64.6% |
| Australians | 99.9 /100 | #47 | Exceptional 64.6% |
| Immigrants | Bulgaria | 99.9 /100 | #48 | Exceptional 64.6% |
| New Zealanders | 99.9 /100 | #49 | Exceptional 64.6% |
| Immigrants | Austria | 99.8 /100 | #50 | Exceptional 64.4% |
| Immigrants | Malaysia | 99.8 /100 | #51 | Exceptional 64.3% |
| Immigrants | Netherlands | 99.8 /100 | #52 | Exceptional 64.2% |
| Asians | 99.8 /100 | #53 | Exceptional 64.2% |
| Zimbabweans | 99.8 /100 | #54 | Exceptional 64.2% |
| Immigrants | Belarus | 99.7 /100 | #55 | Exceptional 64.1% |
| Immigrants | Czechoslovakia | 99.7 /100 | #56 | Exceptional 64.1% |
| South Africans | 99.7 /100 | #57 | Exceptional 64.1% |
| Immigrants | Asia | 99.7 /100 | #58 | Exceptional 64.0% |
| Immigrants | Serbia | 99.6 /100 | #59 | Exceptional 63.8% |